The PC market reached its peak in 2010 with 510 million units, but the introduction of tablets, Chromebooks, and smartphones led to a slowdown in PC sales. The market saw a turnaround in 2019 and experienced a surge in sales in 2020 due to Covid-19. However, the PC boom ended in Q3’22 with the pandemic’s resolution. Despite the overall slowdown, notebooks managed to increase their market share from 63% to 69% in the face of new AIB introductions. Excess inventory in the supply chain impacted the sales of new products, but suppliers believe they have resolved this issue, forecasting a slight upturn for Q3 and Q4. Nvidia has been successful in reducing its inventory, while the data center and AI training systems remain promising. The second half of the year is approached with cautious optimism, and the results of Q2 are eagerly awaited.
As Figure 1 shows, 2010 was the high point of the PC market, reaching 510 million units and causing Intel and others to talk about the next billion. That, of course, didn’t happen, and through a combination of a recession and introduction of tablets, Chromebooks, and smartphones, people found alternative devices to use for their email. They also postponed the bi-annual replacement cycle that had fueled the PC’s market growth for so long. That was partially (some say largely) due to the applications not advancing at the same speed as the hardware and new, faster, more powerful PCs not providing any more performance—due to the apps. The market turned around in 2019, and then thanks to Covid, sales jumped in 2020. Covid ended in Q3’22 and so did the PC boom.
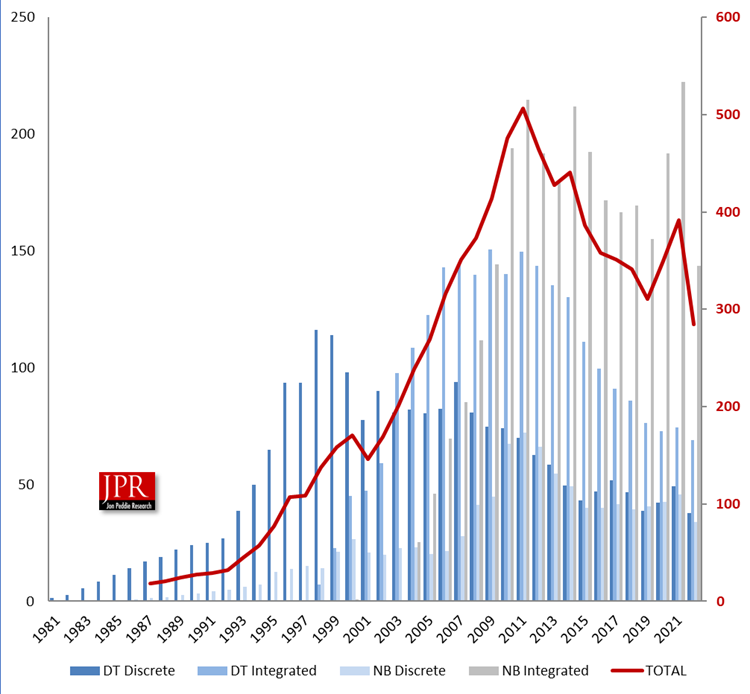
The PC notebook market, once the darling high-growth segment, has seen encouragement from tablets, Chromebooks, and Arm-based notebooks from Apple and other big brand-name suppliers. Despite a general slowdown in PC sales, notebooks managed to increase their share of the PC market from 63% last quarter to 69% this quarter. And that was in the face of new AIB introductions, which should have created more demand than they did.
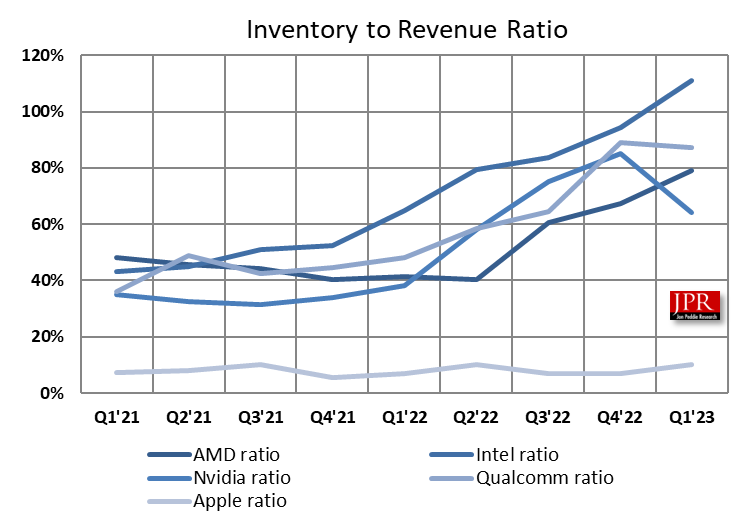
JPR’s Market Watch is a supply-side report that details the GPUs and CPUs going to the OEMs, AIB builders, and distribution channels. That is usually a quarter ahead of consumer and enterprise purchases, and is normally a good predictor of what end-user sales will be like in the following quarter. However, due to the inertia in the supply chain and too much enthusiasm about continued demand after Covid, and the GPU and CPU supplier ended up with too much inventory in Q2 and Q3 2022 and have been trying to get rid of it. While the suppliers run down their excess inventory (euphemistically referred to as burning off the overhang), sales of new products suffer. However, that was not reflected in the demand-side reports, which showed an average of -16% quarter-to-quarter change.
All the suppliers report they believe they’ve worked their way through that excess inventory and that normal seasonality will return in the second half, or by the end of the year at the latest. Therefore, we have a cautious slight upturn forecasted for Q3 and Q4, and a continuation of low sales in Q2, which is traditionally a down quarter. Of the three suppliers, Nvidia has done the best job of reducing its inventory.
Of course, the data center and AI training systems are the bright spot, and leader-of-pack Nvidia in that area has guided a whopping 53% upturn for Q2, defying the tradition and beating its competitors -0.93% (AMD) and -1.8% (Intel). Even though AMD and Intel were not as bullish as Nvidia, their guidance was not as bad as many hedge fund managers expected.
So, it is with cautious optimism we approach the second half and gritted stoicism as we await the results of Q2. The rough ride isn’t quite over yet.
New report, more data
The above information and more can be found in the new Q1’23 edition of Market Watch. We have changed the format of the report from a heavily narrated version to a heavily charted version for easier consumption. Also, we have added server and client CPU shipment data back to Q1’21 and GPU-compute shipment data back to Q1’21 for AMD, Intel, and Nvidia. We have expanded the pivot data array to include those devices.
The x86 GPU market is diverse and can be summarized by any one of the segments.
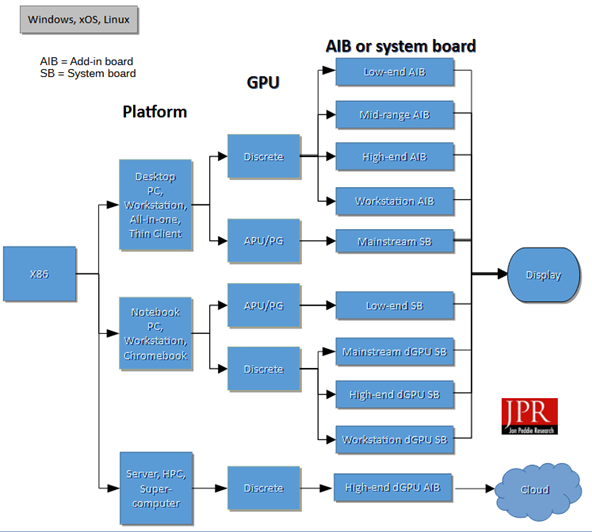
The Market Watch report provides unit shipment data on every segment in the diagram, as well as historical data back to 2014 and a three-year forecast on GPUs.
Comments on our reports, what you like, what we might do differently or better, are always welcomed, in fact solicited.