Seasonal drop is less than in previous years; AMD continues market share increase, but Nvidia still the leader
TIBURON, CA-August 27, 2012—Jon Peddie Research (JPR), the industry’s research and consulting firm for graphics and multimedia, announced estimated graphics Add-in Board (AIB) shipments and sales’ market share for Q2’12. The JPR AIB Report tracks computer graphics boards, which carry discrete graphics chips. They are used in desktop PCs, workstations, servers, and other devices such as scientific instruments. They may be sold as after-market products directly to customers or they may be factory installed. In all cases, they represent the higher-end of the graphics industry as discrete chips rather than integrated processors.
We found that AIB shipments during Q2 2012 did behave according to past years with regard to seasonality, but in unit shipments was lower on a year-to-year comparison and on a quarter-to-quarter comparison for the quarter. Overall, for the AIB, and PC market in general, 2012 has been, and is forecasted to have a decline in shipments due to the popularity of notebooks and worldwide economic depression.
The quarter in general
- Total AIB shipments decreased this quarter, from the previous quarter, by 6.5% to 14.8 million units. (see Table 1)
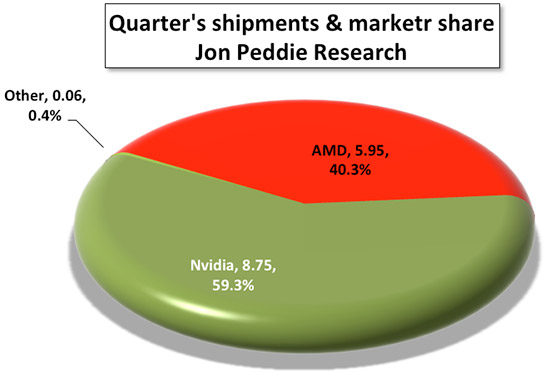
- AMD increased its market share to 40.3%, Nvidia’s market share slipped but still retains a large majority at 59.3%. (see Table 1)
- Year-to-year this quarter AIB shipments were down 7%.
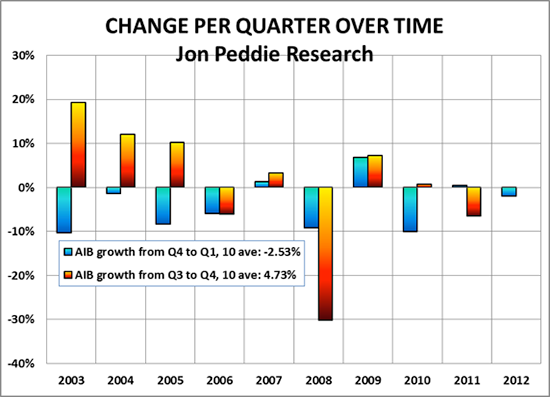
Normally, this quarter of the year is down, and this year’s quarter was no different, but the decline is less than the 10-year average. However, this is just one quarter in a very turbulent year so we can’t use this quarter a prediction of the future, the world-wide economic conditions are just too uncertain.
The change from quarter to quarter is more than last year. Quarter-to-quarter percentage changes are shown in Figure 1.

The ten-year average change for AIBs in the 2nd quarter is -11.3%; this year it was lower at ‑6.5%.
Figure 2 shows the market share and shipment levels for AIB suppliers in the quarter.

AMD introduced the new Radeon HD7000 series early in the quarter and as a result picked up market share.
Nvidia got off to a slow start in Q2 and cited supply constraint as the main reasons for the decline:
Embedded graphics processors at first were simply replacing integrated chipsets, and they did not have a major impact on AIBs. However, the new embedded graphics processor from AMD, the A10 (Trinity) has shown pretty good performance and has replaced entry-level AIBs.
| Shipment (M units) This quarter | Market share this quarter | Last quarter (M units) | Market share last Qtr | Unit Change Qtr-to-qtr | Share Change Qtr-to-qtr | M Units a year ago | Market Share last yr. | |
|---|---|---|---|---|---|---|---|---|
| AMD | 5.95 | 40.3% | 5.97 | 37.8% | -0.3% | 2.5% | 6.54 | 41.2% |
| Matrox | 0.05 | 0.3% | 0.04 | 0.3% | 25.0% | 0.1% | 0.06 | 0.4% |
| Nvidia | 8.75 | 59.3% | 9.77 | 61.9% | -10.4% | -2.6% | 9.27 | 58.4% |
| S3 | 0.01 | 0.1% | 0.01 | 0.1% | 0.0% | 0.0% | 0.02 | 0.1% |
| Total | 14.76 | 100.0% | 15.79 | 100.0% | -6.5% | 15.89 | 100.0% |
The market has decreased year over year. Shipments decreased to 14.8 million units, down 1.1 million units from this quarter last year.
The market for AIBs was down this quarter partially due to seasonality and largely due to economic distress.