The Steam monthly survey collects system data from over 25 million online players, providing a general snapshot of computer hardware and software usage. While expressed in percentages without a specific sample size, it is often considered authoritative and close to reflecting the real world. However, it may not reflect non-Steam gamers’ graphics board preferences. Steam’s data does not distinguish between integrated and mobile graphics units, making it difficult to separate discrete desktop units. Furthermore, the supply chain for desktop discrete graphics cards (AIBs) complicates the correlation between Steam data and supply data. The Steam data primarily represents consumer gamers.
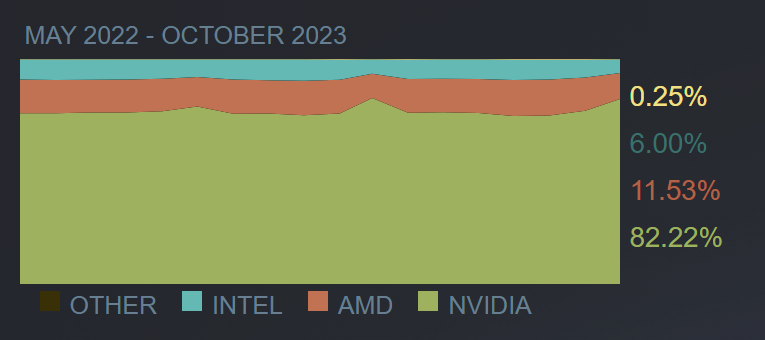
At any given time, Steam has over 25 million players online. Some of those players share their system information with Steam. Steam conducts a monthly survey to collect data about what kinds of computer hardware and software its customers are using. Participation in the survey is optional and anonymous. The problem with the Steam data is that it is only expressed in percentages but not a sample base, so it could be as few as 10 or 100 users. In reality, it probably is in the millions, and that would make the data significant.
Nonetheless, survey gets quoted and is considered authoritative. It is a good general snapshot and probably pretty close to reflecting the real world. The error would come from other game platforms like Ubisoft, Electronics Arts, Blizzard, and others whose users may represent a different mix of graphics boards.
Also, Steam doesn’t break out integrated and mobile in their tally. You can, with some work, look at their raw data and extract those non-discrete desktop units. In the table above, Intel is listed at 6%, but most of that is iGPUs, not Arc boards.
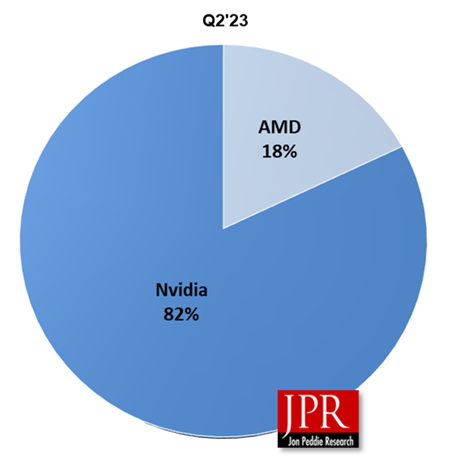
Our Market Watch GPU report for Q2’23 shows Nvidia is indeed the clear winner in market share in all areas of dGPUs.
The other thing that Steam doesn’t show (easily) is the segments of desktop graphics boards (AIBs). It can be pulled out of their raw data because they list model numbers (e.g., RTX 3090).
We do sort Steam’s data and publish the findings in our Add-in Board report.
| STEAM | Q1’22 | Q2’22 | Q3’22 | Q4’22 | Q1’23 | Q2’23 |
| Entry level | 44% | 44% | 44% | 44% | 44% | 44% |
| Midrange | 43% | 43% | 43% | 43% | 43% | 43% |
| High end | 14% | 14% | 14% | 14% | 14% | 14% |
Correlated Steam user data. (Source: JPR/Steam)
In our Market Watch and AIB reports, we show the distribution of desktop dGPUs, and as the following table shows, it doesn’t quite line up with end-user data.
| Q1’22 | Q2’22 | Q3’22 | Q4’22 | Q1’23 | Q2’23 | |
| Entry level | 15% | 16% | 14% | 15% | 14% | 15% |
| Midrange | 41% | 41% | 40% | 36% | 41% | 40% |
| High end | 35% | 34% | 36% | 43% | 35% | 34% |
| Workstation | 9% | 9% | 11% | 6% | 10% | 11% |
Supply-side desktop dGPU shipments. (Source: JPR)
That lack of correlation is due to the supply chain for DT dGPUs. Some go to AIB partners like MSI and Asus, some go to OEMs like Dell and HP, and some go to distributors. And all of those non-end user consumers have some parts in inventory.
So, the Steam data shows a smaller population of high-end AIBs, whereas the supply data from JPR shows a higher ration of high-end AIBs. One speculation is that the high-end AIBs are all going to gamers. Many go to engineers and financial managers, usually via an OEM PC maker. So, it’s important to point out that the Steam data represents consumer gamers.