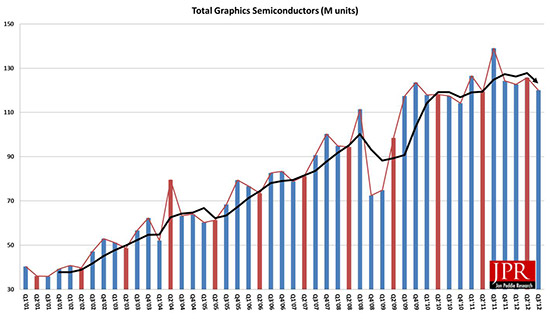
Holding steady: 34.3 Million discrete GPUs shipped, 4.5% over last quarter but declined 5.2% from last year. There was a 4.5% dip in overall graphics shipments in Q3 from last quarter.
TIBURON, CA-November, 2012—Jon Peddie Research (JPR), the industry’s research and consulting firm for graphics and multimedia, announced estimated graphics chip shipments and suppliers’ market share for Q3’12.
The news was terrific for Nvidia and disappointing for everyone the other major players. From Q2 to Q3 Intel slipped in both desktop (7%) and notebook (8.6%). AMD dropped (2%) in the desktop, and (17%) in notebooks. Nvidia gained 28.3% in desktop from quarter to quarter and jumped almost 12% in the notebook segment.
This was a not a very good quarter. The shipments were down -1.45% on a Qtr-Qtr basis, and -10.8% on a Yr-Yr basis. We found that graphics shipments during Q3’12 slipped from last quarter -1.5% as compared to PCs which grew slightly by 0.9% overall (however more GPU’s shipped than PCs due to double attach). GPUs are traditionally a leading indicator of the market, since a GPU goes into every system before it is shipped and most of the PC vendors are guiding down for Q4.
The turmoil in the PC market has caused us to modify our forecast since the last report; it is less aggressive on both desktops and notebooks. The popularity of tablets and the persistent recession are the contributing factors that have altered the nature of the PC market. Nonetheless, the CAGR for PC graphics from 2011 to 2016 is 3.6%, and we expect the total shipments of graphics chips in 2016 to be 608 million units.
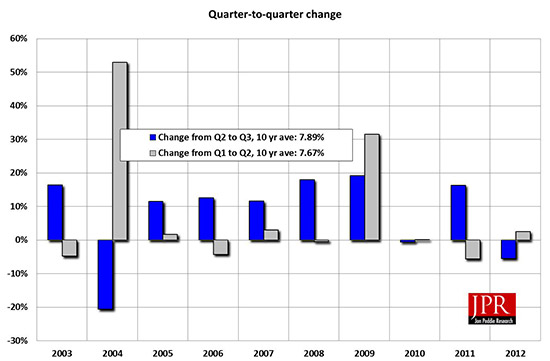
The ten-year average change for this quarter is a growth of 7.9%. This quarter is below the average with a 4.6% decrease.
Our findings include discrete and integrated graphics (CPU and chipset) for Desktops, Notebooks (and Netbooks), and PC-based commercial (i.e., POS) and industrial/scientific and embedded. This report does not include handhelds (i.e., mobile phones), x86 Servers or ARM-based Tablets (i.e. iPad and Android-based Tablets), Smartbooks, or ARM-based Servers. It does include x86-based tablets.
The quarter in general
- AMD’s quarter-to-quarter total shipments of desktop heterogeneous GPU/CPUs, i.e., APUs dropped 30% from Q2 and 4.7% in notebooks. The company’s overall PC graphics shipments slipped 10.7%.
- Intel’s quarter-to-quarter desktop processor-graphics EPG shipments dropped from last quarter by 7%, and Notebooks fell by 8.6%. The company’s overall PC graphics shipments dropped 8%.
- Nvidia’s quarter-to-quarter desktop discrete shipments jumped 28.3% from last quarter; and, the company’s mobile discrete shipments were up 12%, which is impressive in a down market. The company’s overall PC graphics shipments increased 19.6%.
- Year to year this quarter AMD shipments declined 20%, Intel dropped 14%, Nvidia slipped 0.5%, and VIA fell 10% from last year.
- Total discrete GPUs (desktop and notebook) increased a modest 4.6% from the last quarter and were down 5.2% from last year for the same quarter due to the same problems plaguing the overall PC industry. Overall the trend for discrete GPUs is up with a CAGR to 2016 of 2.6%.
- Ninety nine percent of Intel’s non-server processors have graphics, and over 67% of AMD’s non-server processors contain integrated graphics; AMD still ships IGPs.
Year to year for the quarter the graphics market decreased. Shipments were down 20 million units from this quarter last year.
Market shares shifted for the big three, and put pressure on the smaller two, market share in shipments as indicated in Table 1 (units are in millions.)
AMD saw a change of -7.7% in total graphics market share from last year, and -1.5% quarter to quarter.
Intel’s market share increased 0.9% from last year, and -2.4% from last quarter.
Nvidia showed an increase in market share of almost 15% in overall market share from last year rising to 19% from 16% last year.
|
|
Shipment (M units) This quarter |
Market share this quarter |
Last quarter (M units) |
Market share last Qtr |
Unit Change Qtr-to-qtr |
Share Difference Qtr-to-qtr |
M Units a year ago |
Market Share last yr. |
|---|---|---|---|---|---|---|---|---|
|
AMD |
25.43 |
21.2% |
28.49 |
22.7% |
-10.7% |
-1.5% |
31.82 |
23.0% |
|
Intel |
71.75 |
59.8% |
77.97 |
62.2% |
-8.0% |
-2.4% |
83.58 |
60.3% |
|
Nvidia |
22.25 |
18.5% |
18.60 |
14.8% |
19.6% |
3.70% |
22.36 |
16.1% |
|
Matrox |
0.04 |
0.03% |
0.05 |
0.0% |
-20.0% |
0.0% |
0.06 |
0.0% |
|
VIA/S3 |
0.53 |
0.4% |
0.59 |
0.5% |
-10.0% |
0.0% |
0.65 |
0.5% |
|
Total |
120.00 |
100.0% |
125.36 |
100.3% |
-4.3% |
|
138.52 |
100.0% |
Graphics chips (GPUs) and chips with graphics (IGPs, APUs, and EPGs) are a leading indicator for the PC market. At least one and often two GPUs are present in every PC shipped. It can take the form of a discrete chip, a GPU integrated in the chipset or embedded in the CPU. The average has grown from 1.2 GPUs per PC in 2001 to almost 1.4 GPUs per PC.