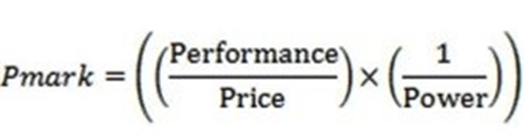
AMD’s two new additions to the midrange segment, the Radeon RX 7800 XT and RX 7700 XT, perform admirably in our Peddie mark (Pmark) testing, where we measure not only the performance of the graphics cards, but factor in the price and power consumption as well.
What do we think? Increasingly, gamers are moving on from 1080p gaming to higher-resolution gaming. These two new graphics cards are primed to provide an upgrade to gamers moving from 1080p gaming to 1440p and beyond. The XFX Radeon RX 7700 XT Qick and the RX 7800 XT performed well in our Pmark testing due to their relatively low cost and low power consumption when compared to their previous-generation counterparts, the RX 6800 XT and RX 6700 XT.
AMD’s midrange Radeon cards, the RX 7800 XT and RX 7700 XT, are put to the test
AMD introduced the two new graphics cards in the 7000 series this month, the RX 7800 XT and the RX 7700 XT. These new cards are priced in the midrange, which has historically been the sweet spot for the graphics add-in board market. The two new additions are targeted at gamers who want to upgrade their gaming experience to 1440p resolution and beyond.
| RX 7800 XT | RX 7700 XT | |
| Architecture | RDNA 3.0 | RDNA 3.0 |
| GPU | Navi NA | Navi NA |
| Compute units | 60 | 54 |
| RT cores | 60 | 54 |
| AI cores | 120 | 108 |
| Game clock (MHz) | 2,124 | 2,171 |
| Boost clock (MHz) | 2,430 | 2,544 |
| Memory (GDDR6) | 16 | 12 |
| Memory interface | 256 | 192 |
| Memory speed | 19.5 | 18 |
| Infinity cache | 64 | 48 |
| TDP | 263W | 245W |
| Release date | September 2023 | September 2023 |
| MSRP (at launch) | $499 | $449 |
Specifications of the RDNA 3.0 midrange graphics cards.
The AMD 7000 series, based on RDNA 3.0 architecture, now consists of the high-end RX 7900 XTX and RX 7900 XT, the midrange RX 7800 XT and RX 7700 XT, and the entry-level RX 7600.
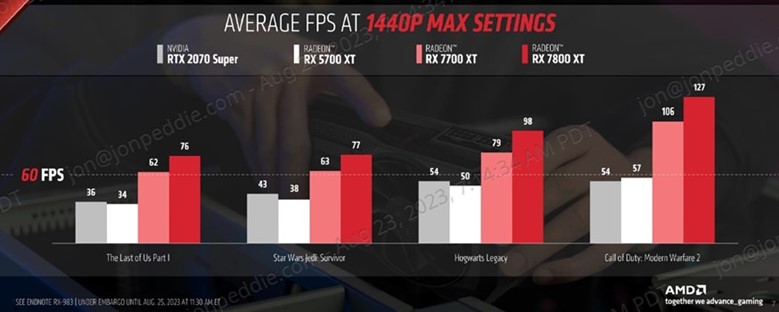
The RX 7800 XT and RX 7700 XT provide a 110% and a 73% average FPS performance jump, respectively, over the RX 5700 XT in 1440p gaming, according to AMD. That is a jump from 40 FPS in 1440p gaming up to 90 FPS, representing a significant increase in performance for gamers.
Today, we compared the two new midrange cards using our Pmark equation.
Test bed and hardware
- AMD Ryzen 7800x3d (stock settings)
- Asrock X670E Pro RS motherboard (AMD AM5 chipset, v. 1.07 BIOS)
- G.Skill Trident Z 32GB DDR5 (2× 16GB, dual-channel at 6,000MHz XMP)
- XFX RX 7700 XT Qick 319
- AMD Radeon RX 7800 XT
- 1× TeamGroup 1TB NVMe M.2 SSD
- 2× WD Blue 1TB SATA SSD
- Corsair RM850x, 850W 80 Plus Gold power supply unit
- Alienware 34-inch curved QD-OLED gaming monitor—AW3423DWF
We were provided an AMD-branded Radeon RX 7800 XT and XFX’s version of its RX 7700 XT and RX 7700 XT Qick 319. You can find a full review of the two new graphics cards on our sister site BabelTech Reviews.
Benchmark suite: PC games
DX11 games
- Total War: Warhammer III (DX11)
DX12 games
- Chernobylite (DX12)
- Call of Duty: Modern Warfare 2 (DX12)
- Cyberpunk 2077 (DX12)
- F1 22 (DX12)
- Far Cry 6 (DX12)
- Resident Evil 4 (DX12)
- Red Dead Redemption 2 (DX12)
- Horizon Zero Dawn (DX12)
- Metro Exodus PC Enhanced Edition (DX12)
- Dirt 5 (DX 12)
Vulkan Games
- Doom Eternal (VK)
| XFX RX 7700 XT Qick 319 | AMD Radeon RX 7800 XT | |
| FPS all games | 96.31 | 116 |
| FPS with ray tracing enabled | 39.27 | 41.97 |
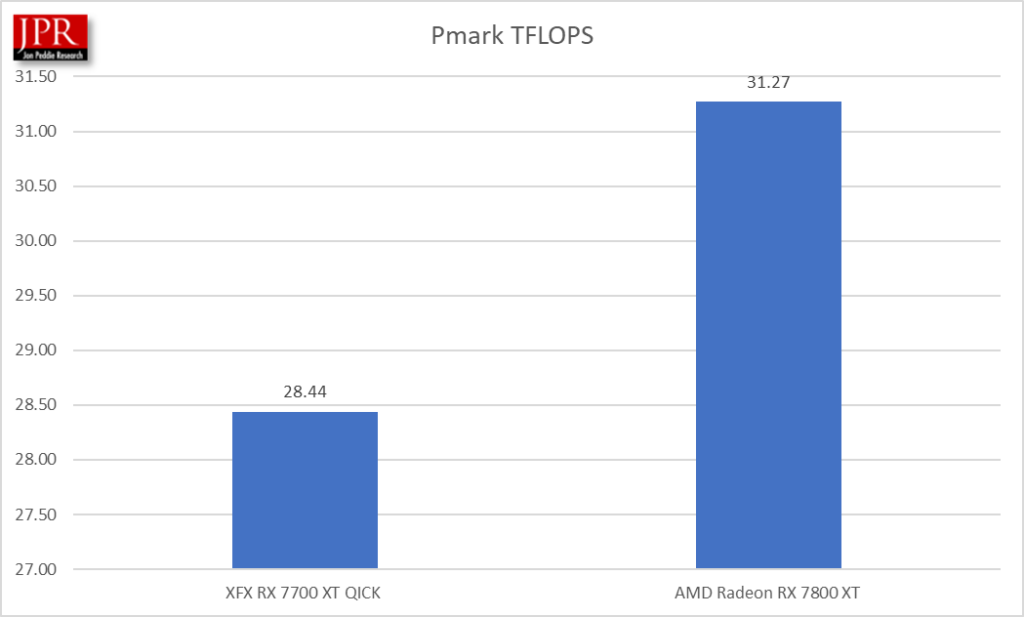
| TFLOPS | 28.44 | 31.27 |
| TDP (watts) | 245 | 263 |
| MSRP (at launch) | $459 | $499 |
Pmark variables.
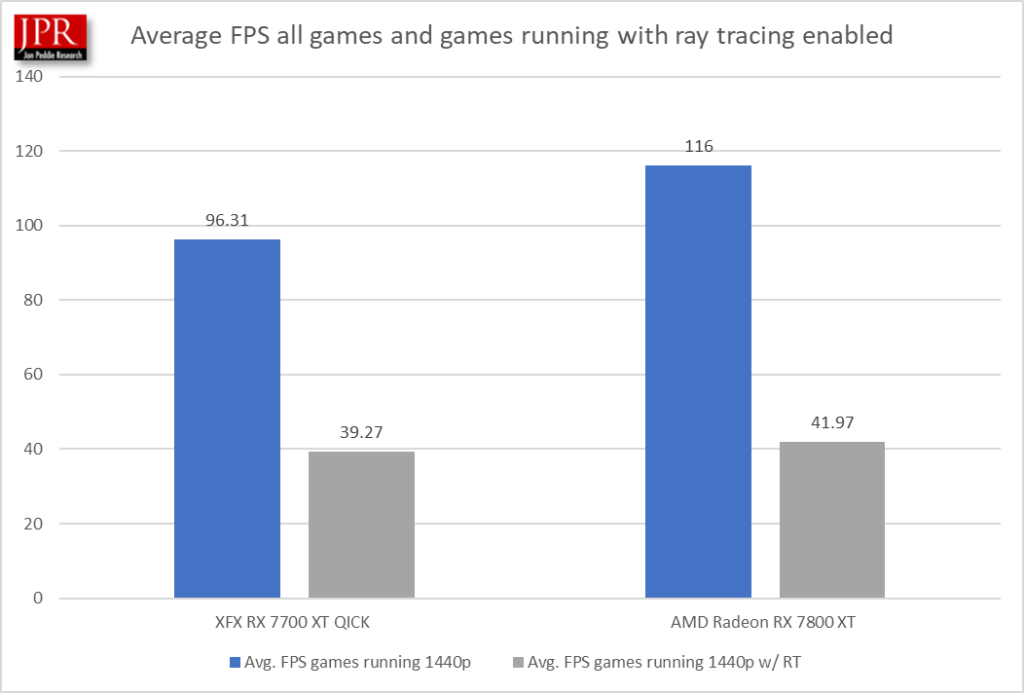
The AMD RX 7800 XT displayed a 17% performance gain over the XTX RX 7700 XT Qick in all games and a 6% improvement in games with ray tracing enabled.

Both new graphics cards performed well in our Pmark testing due to their modest price point and low power consumption—especially when compared to their predecessors.
| RX 7800 XT | RX 6800 XT | RX 7700 XT | RX 6700 XT | % change 7800 vs. 6800 | % change 7700 vs. 6700 | |
| Architecture | RDNA 3.0 | RDNA 2.0 | RDNA 3.0 | RDNA 2.0 | ||
| GPU | Navi NA | Navi 21 | Navi NA | Navi 22 | ||
| TDP | 263W | 300W | 245W | 230W | -12% | -6% |
| Release date | September 2023 | October 2020 | September 2023 | March 2021 | ||
| MSRP (at launch) | $499 | $649 | $449 | $479 | -30% | -6.6% |
Price and power differences of midrange 7000 series AIBs vs. their 6000 series counterparts.
As you can see in the table above, the 7000 series cards were priced at launch well below the RX 6800 XT and RX 6700 XT and consume less power.
The midrange segment is very important to GPU OEMs and graphics card manufacturers—most gamers prefer the midrange, as it outperforms entry-level graphics cards and yet is quite a bit more affordable than high-end graphics add-in boards. The RX 7800 XT and RX 7700 XT provide consumers with quality, affordable options for 1440p gaming.
Midrange consumers used to be saddled to lower resolutions, but these new cards provide solid frame rates at 1440p resolutions. Innovations such as Nvidia’s DLSS, AMD’s FidelityFX, and Intel’s XeSS are now allowing midrange graphics cards to perform very well even at 4K resolution.
For more information on these and other GPUs, refer to the JPR Market Watch report.