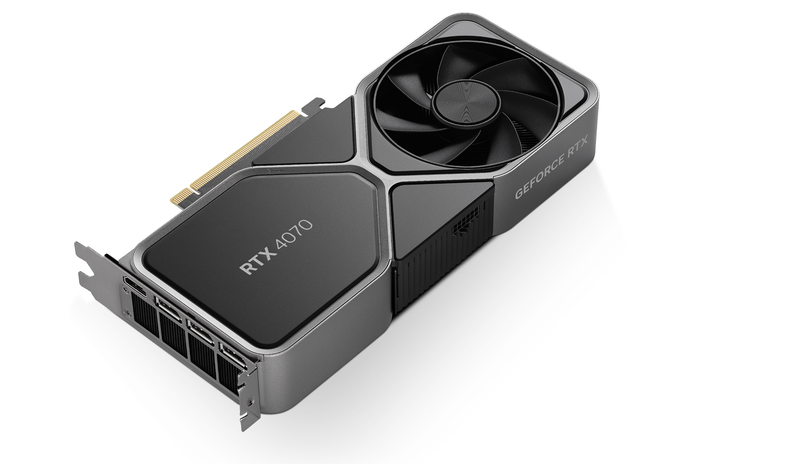
We take a look at the RTX 4070, comparing it to four other add-in boards. The RTX 4070’s performance and low power consumption make this the best performance-per-watt AIB released thus far in the Lovelace line.
Our sister site BableTechreviews posted a thorough review of the new Lovelace-based RTX 4070, which can be read here. In this article, we will be taking the data and matching up the add-in boards with our JPR calculation (Pmark).
The RTX 4070’s MSRP is $599, which is $100 more than its predecessor, the RTX 3070, that launched at $500. Factoring in the added features, inflation, and the boards’ performance, the price markup from the previous generation is not too bad.
The new features include next-gen DLSS 3 as well as Displaced Micro-Meshes, while requiring less power than the RTX 3070.
With more than 400 games and applications now supporting RTX, and over 50 announced titles featuring DLSS 3, it’s clear that this technology is quickly becoming a game-changer for boards especially in the midrange and entry level. According to Nvidia, DLSS 3 has the fastest adoption rate of any of their technologies to date, being adopted seven times faster than DLSS 2. And with upcoming titles like Forza Horizon 5, Diablo IV, Redfall, and The Finals featuring DLSS 3, the value proposition for potential buyers is undeniable.
Features and specifications
The RTX 4070 technological innovations include:
- New Streaming Multiprocessors (SM)—The new SMs deliver up to 2× performance and power efficiency.
- Fourth-generation tensor cores and Optical Flow—Enable and accelerate transformative AI technologies, including the new frame rate multiplying Nvidia DLSS 3.
- Third-generation RT cores—Up to 2× ray-tracing performance, delivering detailed virtual worlds.
- Shader Execution Reordering (SER)—SER improves ray-tracing operations by 2×, boosting FPS up to 44% in Cyberpunk 2077 with RT in Overdrive Mode.
- DLSS 3—Nvidia’s latest AI-powered graphics that boosts performance using AI to generate additional high-quality frames.
- Nvidia Studio—High performance in 3D rendering, video editing, and live streaming.
- AV1 encoders—The eighth-generation Nvidia Encoder (NVENC) with AV1 is 40% more efficient than H.264, enabling new possibilities for streamers, broadcasters, and video callers. We matched up the RTX 4070 against the RTX 3070, RTX 3080, and the RTX 4070 Ti.
The RTX 4070 is based on the AD104 GPU and comes equipped with 5,888 CUDA cores, providing 29 FP32 shader-TFLOPS of power for rendering traditional rasterized graphics. The RTX 4070 also boasts 184 fourth-generation tensor cores, offering 466 tensor-TFLOPS for AI processing and DLSS. Nvidia boasts that this means one could experience next-level graphics with AI-powered upscaling and image enhancement while maintaining high frame rates.
In addition, the RTX 4070 has 46 third-generation Ada RT cores capable of 67 RT-TFLOPS for powering next-generation ray-traced graphics, allowing for realistic lighting and shadows in real time. The new board has 12GB of GDDR6X memory, which is 4GB more than the RTX 3070.
We matched up the RTX 4070 with the RTX 3070, RTX 3080, and the RTX 4070 Ti.
| RTX 3070 | RTX 4070 | RTX 4070 Ti | RTX 3080 | |
| Architecture | Ampere | Lovelace | Lovelace | Ampere |
| GPU | GA104 | AD104 | AD104 | GA102 |
| Process node | 8 | 5 | 5 | 8 |
| Transistors (b) | 17,400 | 35,800 | 35,800 | 28,300 |
| Die size (mm²) | 392 | 295 | 295 | 628 |
| Streaming cores/Cuda cores | 5,888 | 5,888 | 7,680 | 8,704 |
| RT cores | 46 | 46 | 60 | 68 |
| TFLOPS | 20 | 29 | 40.09 | 29.77 |
| Base clock (MHz) | 1,500 | 1,920 | 2,310 | 1,440 |
| Boost clock (MHz) | 1,725 | 2,475 | 2,610 | 1,710 |
| Memory type | GDDR6 | GDDR6X | GDDR6X | GDDR6X |
| Memory size (GB) | 8 | 12 | 12 | 10 |
| Memory speed (Gb/s) | 14 | 21 | 21 | 19 |
| Bandwidth (GB/s) | 448 | 504 | 504 | 760.3 |
| TDP (W) | 220 | 200 | 285 | 320 |
| MSRP | $499 | $599 | $799 | $699 |
Add-in board specifications.
Test bed
We benchmark using FrameView on a recent install of Windows 11 Pro Edition 22H2, at 3440×1440 using an Intel Core i7-12700K with stock clocks and 32GB of DDR4 Corsair Vengeance RGB Pro 3,600MHz memory on an Asus Prime Z690-P D4 motherboard. All games and benchmarks are the latest versions, and we used the latest GeForce 531.42 press drivers for our testing. The games tested, display driver, settings, and hardware are identical except for the GPUs that we compared.
Our benchmark suite consisted of 12 games running DX11, DX12, and Vulkan, as well as 3DMark synthetic tests. All games were run at 3440×1440.
| Total War: Warhammer III (DX11) | Chernobylite (DX12) |
| Call of Duty: Modern Warfare 2 (DX12) | Cyberpunk 2077 (DX12) |
| F1 22 (DX12) | Far Cry 6 (DX12) |
| Resident Evil 4 (DX12) | Red Dead Redemption 2 (DX12) |
| Horizon Zero Dawn (DX12) | Metro Exodus PC Enhanced Edition (DX12) |
| Dirt 5 (DX 12) | Doom Eternal (Vulkan) |
| 3DMark DLSS Feature Test | Fire Strike Extreme |
| Fire Strike Ultra | Time Spy |
| Time Spy Extreme |
Test Suite.
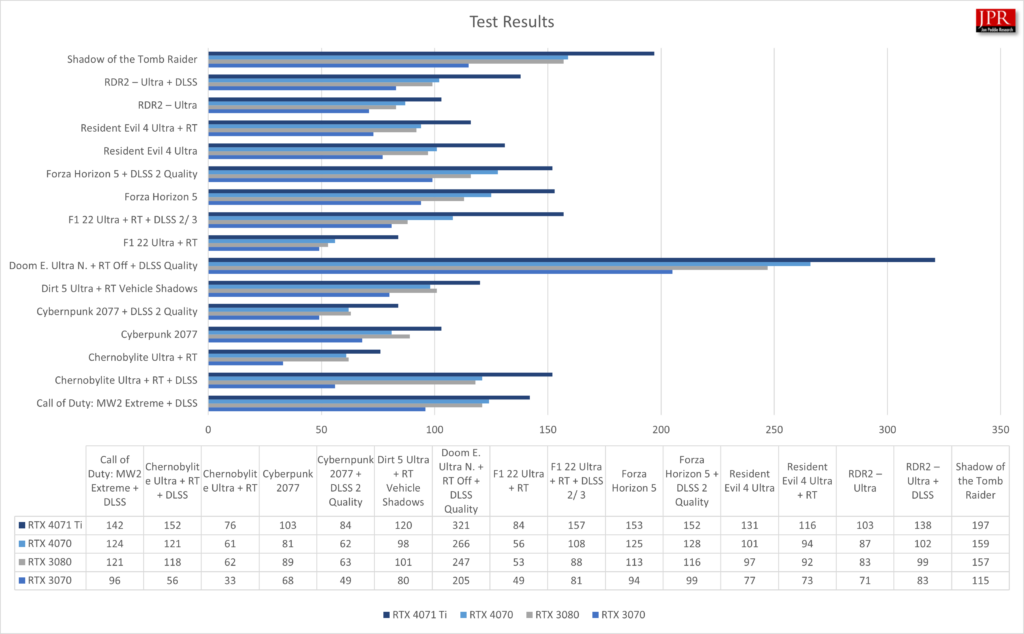
Testing results
| RTX 3070 | RTX 3080 | RTX 4070 | RTX 4070 Ti |
| 76 | 92.75 | 96 | 122 |
Average frame rates for all games.
The RTX 4070 outperformed the RTX 3070 by 33.14% when it came to FPS across all games and jumped to 44.6% in tests where ray tracing was enabled, while using 9% less power.
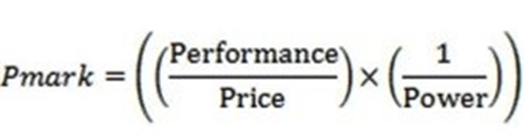
Pmark calculations
JPR has been using its Pmark calculations to compare graphics boards for over a decade. The Pmark scores factor overall performance of the add-in board and also its price and power.
| RTX 3070 | RTX 4070 | RTX 4070 Ti | RTX 3080 | |
| FPS all games | 83.07 | 110.81 | 139.31 | 106.19 |
| FPS with RT enabled | 62 | 89.67 | 117.5 | 8567 |
| Synthetic score avg. | 11,709 | 15,044 | ||
| TFLOPS | 21.31 | 29.15 | 40.09 | 29.77 |
| TDP (W) | 220 | 200 | 285 | 320 |
| MSRP (at launch) | $500 | $599 | $799 | $700 |
Pmark variables.
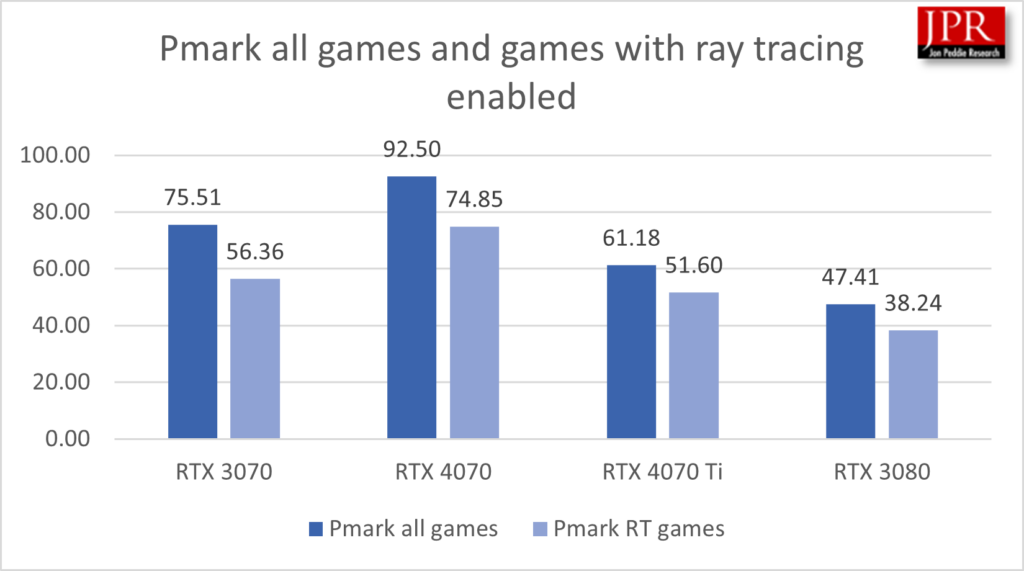
The RTX 4070 was the top performer in our Pmark testing, its frame rates were competitive, but its relatively low power compared to the rest of the add-in boards really gave it an edge. The RTX 4070 outscored the RTX 3080 by 46.75% when factoring all games in the Pmark calculation, and that percentage jumped to 59% with games in which ray tracing was enabled. The RTX 4070 outperformed the RTX 4070 Ti in Pmark by a whopping 81% in all games and 73% in games with ray tracing enabled. The RTX 4070 Ti provides 20% better frame rates when factoring in all the games, but lower cost and lower power usage of the RTX 4070 more than makes up for it in the calculation.
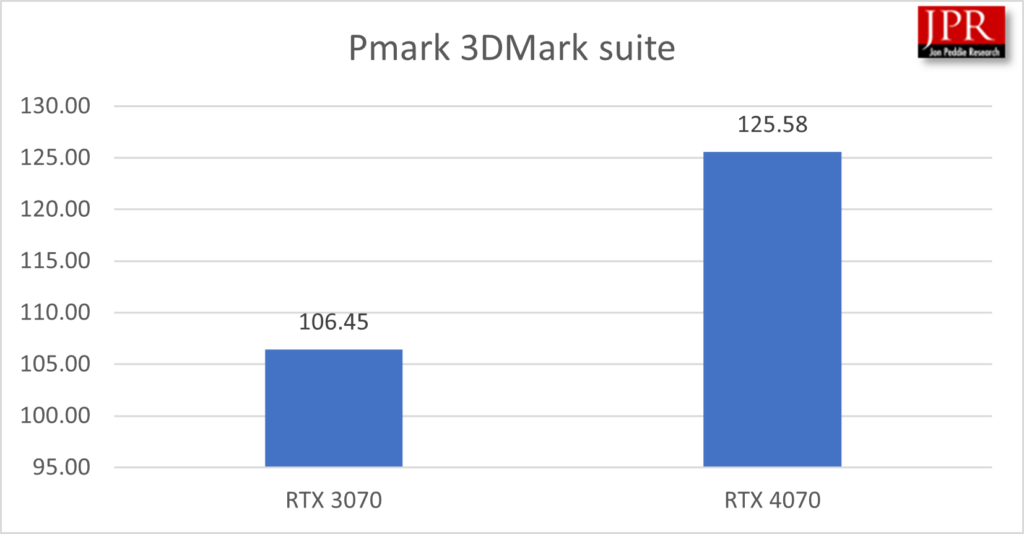
The RTX 4070 outperforms its predecessor by 41% in Pmark scoring using the 3DMark suite, Fire Strike, and Time Spy.
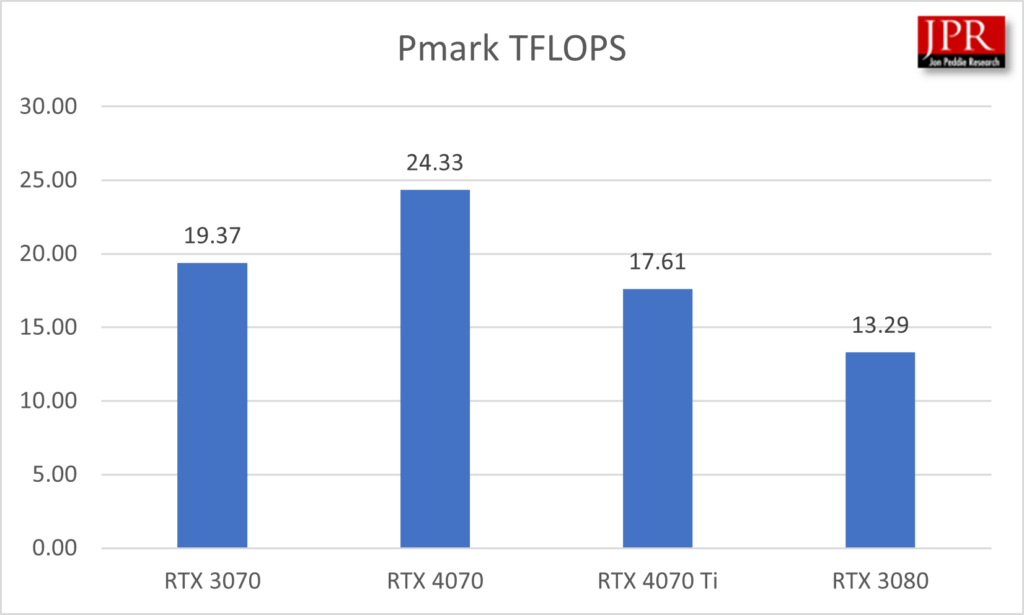
The RTX 4070 also scored better in the Pmark calculation when it comes to TFLOPs, scoring 50% better than the RTX 3080 and 27% better than the RTX 4070 Ti, again this is due to the low power consumption and performance of the new AIB.
What do we think?
The RTX 4070 was most impressive when it came to our Pmark comparison, outclassing every other board it was compared to by a wide margin.
When compared to the other add-in boards in Nvidia’s Lovelace series, the RTX 4070 is the leader in the clubhouse when it comes to performance per watt and value for gamers. In fact, this might be the best performance-per-watt AIB released in the high-end for the past 10 years. It certainly outdistances the RTX 3070.
The addition of DLSS 3 is a game-changer; it will allow midrange AIBs to provide solid frames per second at 4K resolutions with the bells and whistles turned on.