While at CES Nvidia introduced its latest family member, the RTX 4070 Ti, which joins siblings RTX 4080 and 4090 at the high-end hierarchy. However, it has slightly different DNA from those relatives. The 4070 Ti is a separate die (AD104) and offers intrinsic architectural improvements from the Ada design.
The GPU on the RTX 4070 Ti AIB is fabricated on TSMC’s 4N custom process and has 35.8 billion transistors with over 7,680 CUDA cores. The Ada architecture features an improved streaming multiprocessor (SM), Xtra-fast GDDR6X memory, 3rd-gen ray-tracing cores, fourth-generation tensor cores for AI inference operations, 8th-generation encoders with support for AV1, and DLSS improvements that enable high-frame-rate and high-resolution gaming at Ultra settings with ray tracing enabled in the latest games.
The Ada design delivers 40 Shader-TFLOPS compared to 21.7 TFLOPS on the RTX 3070 Ti. Ada’s SM includes a new design, called shader execution reordering (SER), which reschedules work on the fly, providing up to a 200% speedup for the ray-tracing shaders. Nvidia thinks SER is as big of an innovation for GPUs as out-of-order execution was for CPUs.
Another big claim Nvidia makes about the Ada architecture is its 4th-generation tensor core. The new tensor core in Ada includes the Hopper FP8 transformer engine, which Nvidia says can deliver over 641 FP8 tensor TFLOPS with sparsity in the RTX 4070 Ti for AI inference workloads compared to the Ampere based RTX 3070 Ti which delivered 348 Tensor TFLOPS. //rewrite. That line hangs there, not sure what you are trying to say. Compared to FP16, FP8 halves the data storage requirements and doubles AI performance. The question is, what applications make use of AI inferencing? AI-like operations have been used in behaviors primarily in non-player characters (NPCs). Modern games often implement existing techniques such as pathfinding and decision trees to guide the actions of NPCs. For example, inferring the position of an unseen object from past observations can be a difficult problem when AI is applied to robotics, but in a computer game, an NPC can simply look up the position in the game’s scene graph. That’s a lookup operation, not inferencing. Inference refers to the process of using a trained neural network model to make a prediction.
Nvidia took those concepts and constructs, and applied them in a clever way to image processing in what they call DLSS (which we’ve written about several times). Nvidia is using inferencing of incoming frames to predict how the image could look if scaled up to higher resolutions. It’s more than just simple tweening; it’s real analysis and weighted adjustments.
Nvidia is also proud of their 3rd-generation RT core. The company claims its new Opacity Micromap Engine speeds up ray tracing of alpha-tested geometry by 200%, and a new Micro-Mesh engine, increases geometric richness without the bounding volumes hierarchies (BVH) build and storage cost. Nvidia says Ada ray-triangle intersection throughput delivers 93 RT-TFLOPS, compared to 3070 Ti’s 42.5 RT-TFLOPS.
There has been a lot of research on optimizing tree data structures for making ray tracing faster, such as bounding volumes hierarchies (BVH), which speed up ray-trace queries by using an object space partition tree. On BVH trees, each node has a bounding volume that encloses the bounding volumes of all its children.
Nvidia’s Micro-Mesh is a new graphics primitive from the company for real-time path tracing. Displaced Micro-Mesh and Opacity Micromap SDKs give developers the tools and sample code for the creation, compression, manipulation, and rendering of micro-meshes. From fossils to crawling creatures to nature, you can express these assets in their full richness. This is a really powerful capability, but it is not in any game yet. The next generation of games will exploit it, which means the 4070 Ti has a good lifetime expectation.
The hardware suppliers have been leading the software developers for almost two decades now. And no matter how much lead the hardware companies give the software companies, the hardware always seems to move ahead faster—there’s no Moore’s Law for software, just Brook’s Law—adding manpower to a late software project makes it later.[1]
But AI—including neural graphics and generative AI—is using some of the capabilities of the latest GPU hardware to further accelerate games and other applications far above what hardware improvements could provide on their own. This use of AI will have major implications on the performance and capabilities of future games and applications.
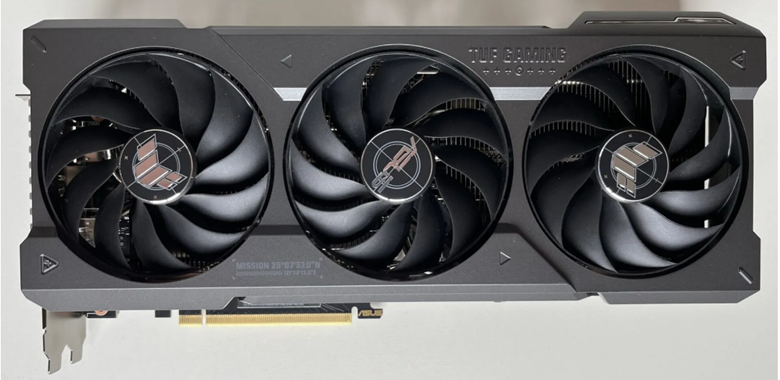
Now, on to the testing. The version of the RTX 4070 Ti that we tested was the Asus TUF OC Edition with 12GB of DDR6X onboard memory. Nvidia’s MSRP for RTX 4070 Ti GPUs is $799, and Asus’ price for the RTX 4070 Ti TUF Gaming OC Edition is $849.99. This is approximately $50 over Nvidia’s MSRP price for a quality well-cooled, tri-fan custom model with a factory GPU overclock of 120MHz over the Nvidia reference 2,610MHz boost clock. The RTX 4070 Ti TUF Gaming OC has the same default GPU clock of 2,310MHz and boost GPU clock of 2,730MHz–120MHz higher than the reference—using both VBIOS modes, so the only difference between VBIOS modes is the fan curve.
Our sister site BableTechReviews ran the RTX 4070 Ti through its own series of tests, the review can be found here.
[1] Brooks, Fred, The Mythical Man-Month, Addison-Wesley
Key features from Asus
- Dedicated 3rd-generation ray-tracing cores (60)
- Dedicated 4th-generation tensor cores (240)
- Nvidia DLSS 3 support
- Game-ready and Nvidia Studio drivers
- Nvidia GeForce Experience
- Nvidia Broadcast
- Nvidia G-Sync
- Nvidia GPU boost
- PCI Express Gen 4
- Microsoft DirectX 12 Ultimate support
- Support for Vulkan RT APIs, Vulkan 1.3, and OpenGL 4.6
- HDCP 2.3 support
- DisplayPort 1.4a support: up to 4K at 240Hz or 8K at 60Hz with DSC, HDR
- HDMI 2.1a support: up to 4K 240Hz or 8K 60Hz with DSC, Gaming VRR, HDR
The physical dimensions of the RTX 4079 Ti follow the RTX 4080 and RTX 4090, with a length of 12 inches, width of 5.4 inches, and height of 2.55 inches.
We tested the RTX 4070 Ti along with the RTX 4080 and the previous-generation 70 Ti, the RTX 3070 Ti. Some charts will also reflect scores for the flagship AIB of the Lovelace series, the RTX 4090.
The following table contains the specs for the RTX 4070 Ti verses the RTX 4080 and RTX 3080 Ti.
| RTX 4070 Ti | RTX 3070 Ti | RTX 4080 | % difference 4070 Ti v. 3080 Ti | % difference 4070 Ti v. 4080 | |
| Architecture | Lovelace | Ampere | Lovelace | ||
| GPU | AD 104 | GA 104 | AD 103 | ||
| Process node | TSMC 4.0 | Samsung 8.0 | TSMC 4.0 | ||
| Transistors (b) | 35.8 | 17.4 | 45.9 | 105.75% | -22.00% |
| Die size (mm²) | 295 | 392 | 379 | -24.74% | -22.16% |
| Streaming cores/Cuda cores | 7,680 | 6,144 | 9,728 | 25.00% | -21.05% |
| RT cores | 60 | 48 | 76 | 25.00% | -21.05% |
| TFLOPS | 21.75 | 48.74 | 88.05% | -16.09% | |
| Base clock (MHz) | 2,310 | 1,575 | 2,205 | 46.67% | 4.76% |
| Boost clock (MHz) | 2,610 | 1,770 | 2,505 | 47.46% | 4.19% |
| Memory type | GDDR6X | GDDR6X | GDDR6X | NA | NA |
| Memory size (GB) | 12 | 8 | 16 | 50.00% | -25.00% |
| Memory speed (Gb/s) | 21 | 19 | 22.4 | 10.53% | -6.25% |
| Bandwidth (GB/s) | 504.2 | 608.3 | 716.8 | -17.11% | -29.66% |
| TDP (W) | 285 | 290 | 320 | -1.72% | -10.94% |
| MSRP (at launch) | $799 (Asus TUF OC $850) | $599 | $1,199 | 33.39% | -33.36% |
| FPS game avg. 1440p | 140.4 | 97 | 154 | 50.91% | -21.7% |
| FPS game avg. 4K | 83 | 55 | 106 | 65.5% | -22.6% |
| FPS avg. RT benchmarks | 48 | 29 | 62 | 65.52% | -22.58% |
The Mt. Tiburon testing Labs test bed specifications:
CPU: 3.00GHz Intel 13th Gen Core i9-13900K
MB: AsusTek Computer Inc. TUF Gaming Z790-Pplus WIFI D4 Rev 1.XX
Drives: Samsung SSD 960 Pro 512GB
T-Force TM8FP8002T 2048.41 GB
RAM: 32MB Corsair Vengeance DDR 4 3600
OS: Windows 11 Pro–10.0.22621 Build: 22621
Our testing suite consisted of synthetic benchmarks, multiple games, and ray-tracing benchmarks. All gamers were testing with the highest presets available with ray tracing enabled when available. We tested games in 4K and 1440p resolutions.
Games utilized in testing are listed in the following table.
| Metro Exodus Enhanced | Red Dead Redemption 2 |
| Godfall | Assassins Creed Valhalla |
| Watch Dogs: Legion | Far Cry 6 |
| Wolfenstein: Youngblood | Chernobylite Enhanced Edition |
| Evil Genius 2 | F1 22 |
| Guardians of the Galaxy |
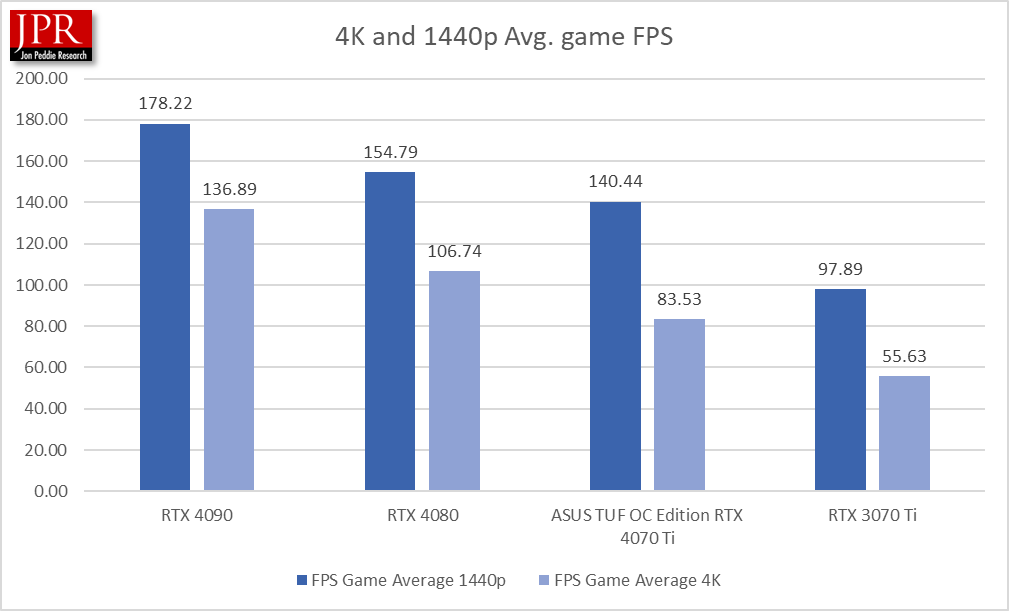
On average, the 4070 Ti scored 44% better than the RTX 3070 Ti in 1440p game testing and showed a 50% improvement in 4K game testing.
Along with a suite of games, the add-in boards were tested with UL and Basemark benchmarks.
| TimeSpy | TimeSpy Extreme |
| Speedway | Basemark: Relic of Life |
| Port Royal |
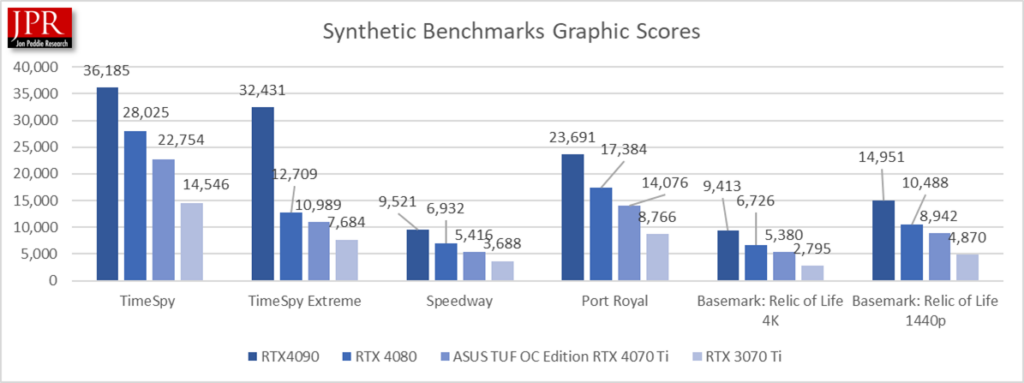
On average, the Asus TUF OC RTX 4070 Ti showed a 68% improvement over the 3070 Ti and was outperformed by 17% by the RTX 4080. This is a solid result considering the 33% price difference between the RTX 4080 and RTX 4070 Ti.
The ray-tracing synthetic benchmark suite consisted of UL, Boundary, and Bright Light Infinite tests.
| Port Royal | 3DMark DirectX RT |
| Boundary RT 4K No DLSS | Boundary RT 1440p No DLSS |
| Bright Light infinite 4K No DLSS | Bright Light infinite 1440p No DLSS |
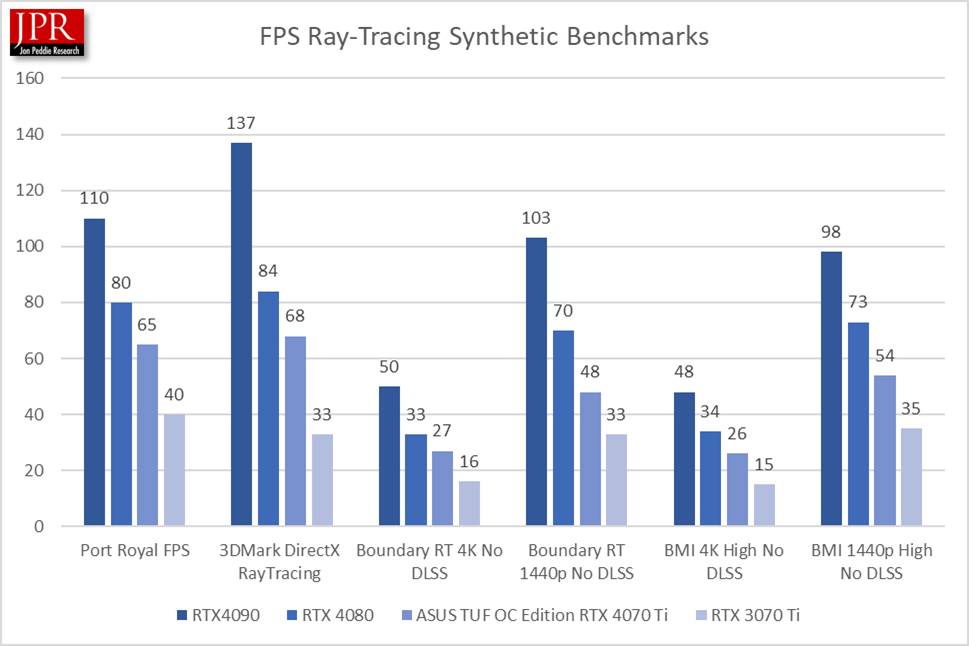
The 4070 Ti outperformed the 3070 Ti by 68% on average, while showing a -22% decrease in performance when compared to the RTX 4080.
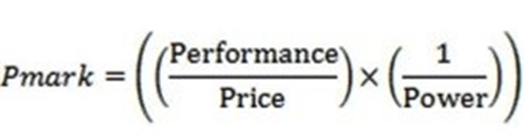
The raw average FPS and synthetic scores are represented in the following table. In addition to the game scores, JPR includes its Pmark computation, which factors in the power and MSRP of the add-in boards.
| Asus TUF OC RTX 4070 Ti | RTX 3070 Ti | RTX 4080 | |
| 4K Avg. FPS | 83 | 55 | 106 |
| 1440p Avg. FPS | 140 | 97 | 154 |
| Synthetic Avg. scores | 13,308 | 8,671 | 16,262 |
| TFLOPS | 40.9 | 21.75 | 48.7 |
| $MSRP | $850 | $599 | $1,199 |
| TDP(Watts) | 285 | 290 | 320 |
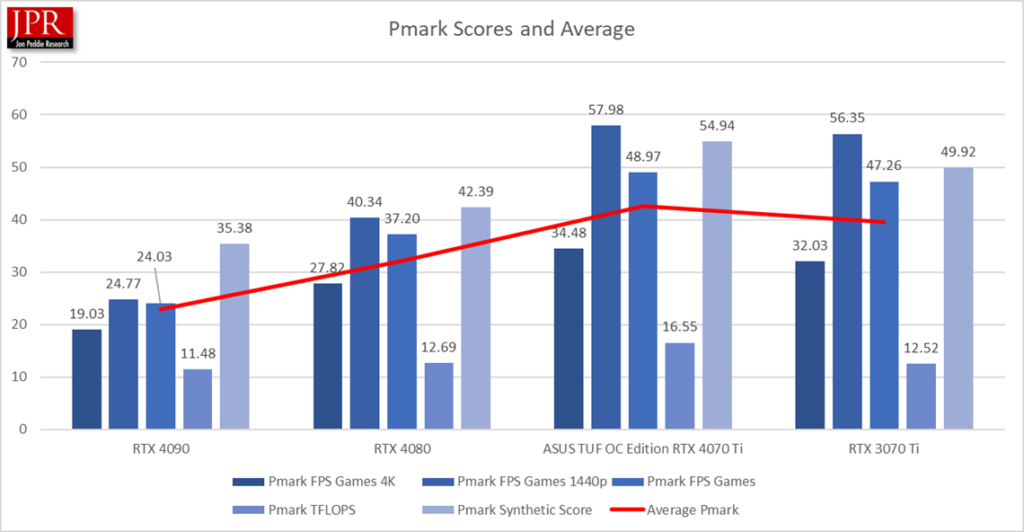
The Asus TUF OC Edition of the RTX 4070 Ti performed remarkably well in the Pmark comparison. Overall, the RTX 4070 Ti led all other add-in boards in the Pmark calculation, besting the RTX 4080 by 32% and the RTX 3070 Ti by 7.5% on average.
The RTX 4070 Ti price and relatively low wattage when compared to the RTX 3070 Ti and RTX 4080 give the add-in board an advantage in the Pmark, allowing it to score so well.
The price-performance comparison is displayed in the following chart.
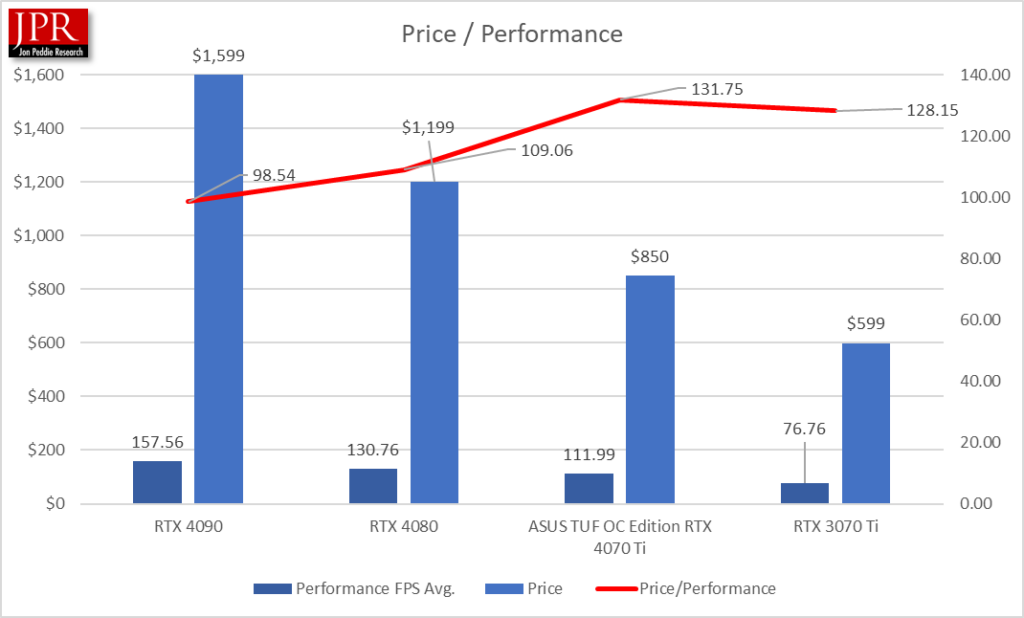
The RTX 4070 Ti enjoys a 21% advantage over the RTX 4080 in price-performance.
What do we think?
The Asus TUF OC RTX 4070 Ti ranks best in price-performance. The new add-in board delivers high frame rates at a reasonable cost for a high-end board. The $850 price is not a trivial sum of money, but given the rise in prices of the high-end segment over the past few years, the $799 price point (suggested MSRP) is sensible given its performance in high resolutions.
The Lovelace series provides many advantages over Ampere. The Ada design delivers 40 Shader-TFLOPS, compared to 21.7 TFLOPS on the RTX 3070 Ti. Ada’s SM includes a new design, called shader execution reordering (SER), which reschedules work on the fly, providing up to a 200% speedup for the ray-tracing shaders.
If you are looking to upgrade to the 4000 series and do so at a reasonable price point, the Asus TUF OC RTX 4070 Ti is worth taking a hard look at.