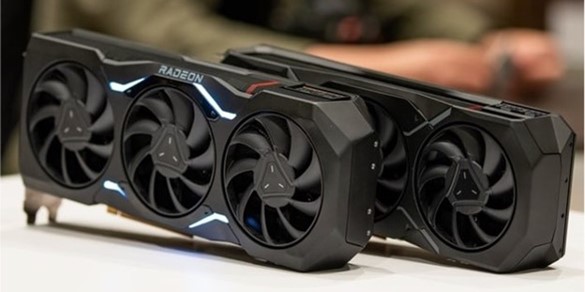
AMD introduced its 7000 AIB series this month with the debut of the RX 7900 XTX and RX 7900 XT. Today, we are taking a close look at the flagship add-in board of the new family—the RX 7900 XTX.
The company introduced the new GPU and claimed it was the first chiplet gaming GPU. They support that claim by putting the 6nm cache memory (MCD) outside the 5nm graphics compute chip (GCD). To stifle critics of off-chip cache, AMD revealed the performance:
- 61 TFLOPS
- 5.3TB/s (while asserting it is the fastest chiplet interconnect based on internal testing)
- Local AIB memory up to 24GB (GDDR6)
- 58 billion transistors—165% more transistors per mm2 than the RDNA 2.0
AMD leveraged its expertise in chiplet technology from its Ryzen and EPYC, and adapted to the RDNA 3.0-based GPU.
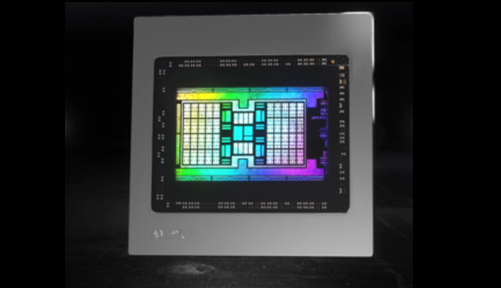
The highly specialized dies are connected through a 5.3TB/s interconnect, making it, claims AMD, the fastest chiplet interconnect in the world. With the Graphics Compute Die (GCD), AMD applied the newer 5 nm process in the core GPU engine, where all the computation occurs. For the smaller Memory Cache Die (MCD), the company used the mature 6 nm technology to implement the GDDR6 memory interfaces and AMD’s second-generation Infinity Cache.
With RDNA 3 compute units, AMD evolved its ray-tracing acceleration through several enhancements. Ray-tracing acceleration got multiple hardware and software optimizations in this generation, which the company claimed will keep pace with the latest needs in real-time rendering ray-tracing workloads. AMD employed methods to skip parts of the acceleration structure during traversal to more efficiently execute the workload. An enhanced cache structure allows more rays to be inflight for faster performance. For heavier RT pipelines, ray-tracing performance can be improved, says AMD, by up to 1.8× in select titles.
The AMD RDNA 3 also introduced the new Radiance Display Engine featuring the industry’s first DisplayPort 2.1. With a DisplayLink bandwidth of up to 54Gb/s, AMD doubled the display bandwidth per port over AMD RDNA 2.
Previous-generation GPUs, including those recently launched for enthusiasts, only support DisplayPort 1.4, and gamers who purchase those graphics AIBs will see limited frame rates. The RX 7900 series will allow gamers to see all frames, says the company.
DisplayPort 2.1 monitors, expected in early 2023 from leading vendors, will be available on the market.
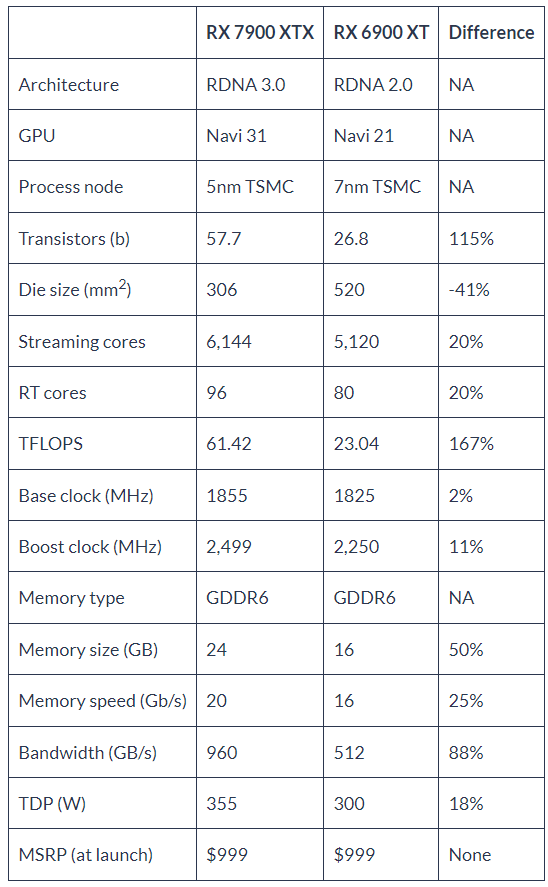
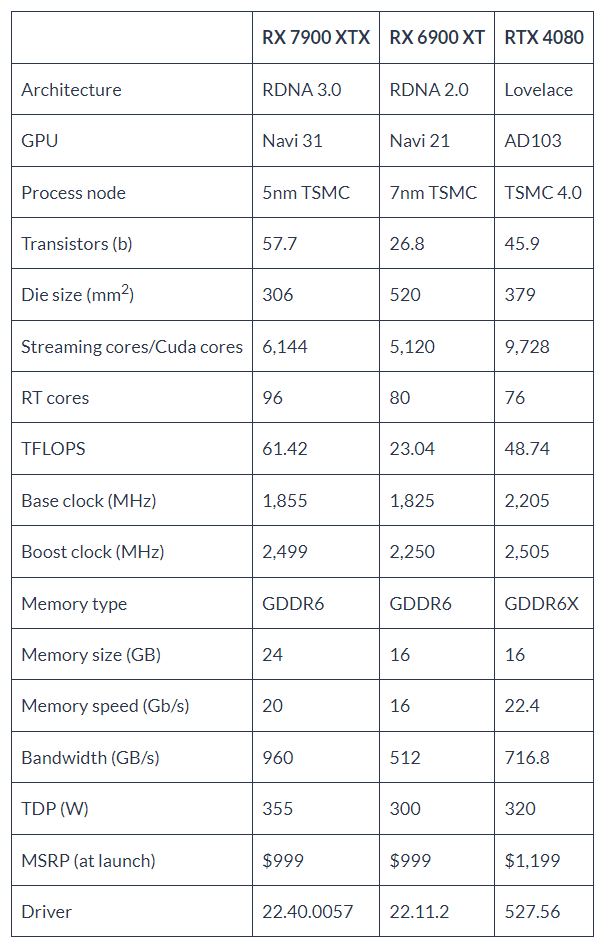
Below is a comparison of the new RDNA 3.0-based Navi 31 to the previous-generation Navi 21—the transistor count jumped 115% despite the 40% smaller die size. There are 20% more streaming cores on the Navi 31 as well as 20% more ray-tracing cores.
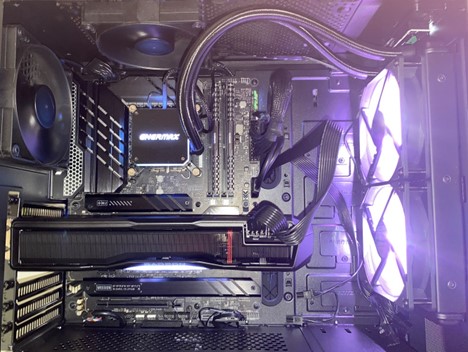
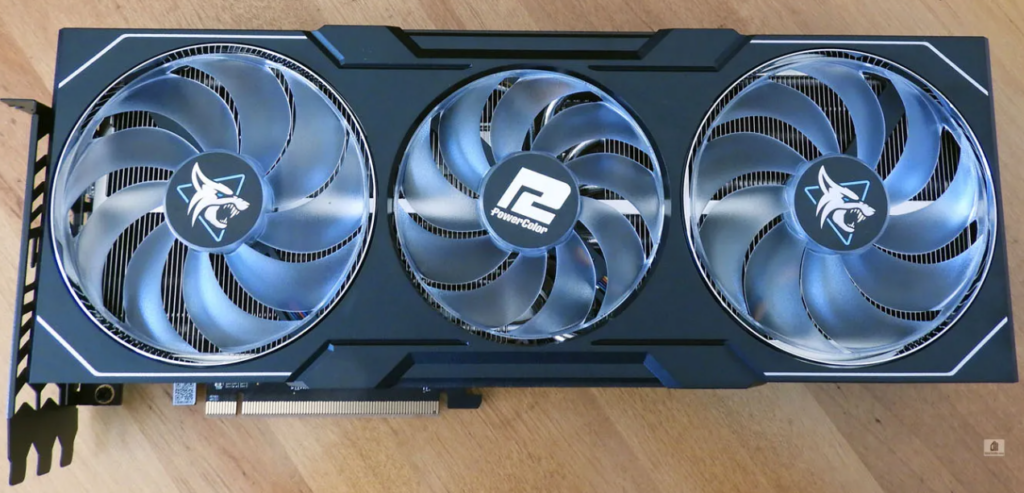
We used two versions of the RX 7900 XTX in our testing—the AMD reference add-in board as well as the PowerColor Hellhound RX 7900 XTX.
Launched at $999, the Hellhound RX 7900 XTX has its factory game clock set 30 MHz higher than the reference version’s 2300 MHz. According to PowerColor specifications, the Hellhound RX 7900 XTX can boost its game clock to 2,330 MHz (2,270 MHz silent) with the OC BIOS. The game clock is the expected GPU clock while running high-load gaming scenarios with a regular non-overclocked total graphics usage situation. However, the GPU boost clock can reach as high as 2525 MHz—25 MHz higher than the base frequency—by using the OC BIOS, and we will test this.
Additional information from PowerColor
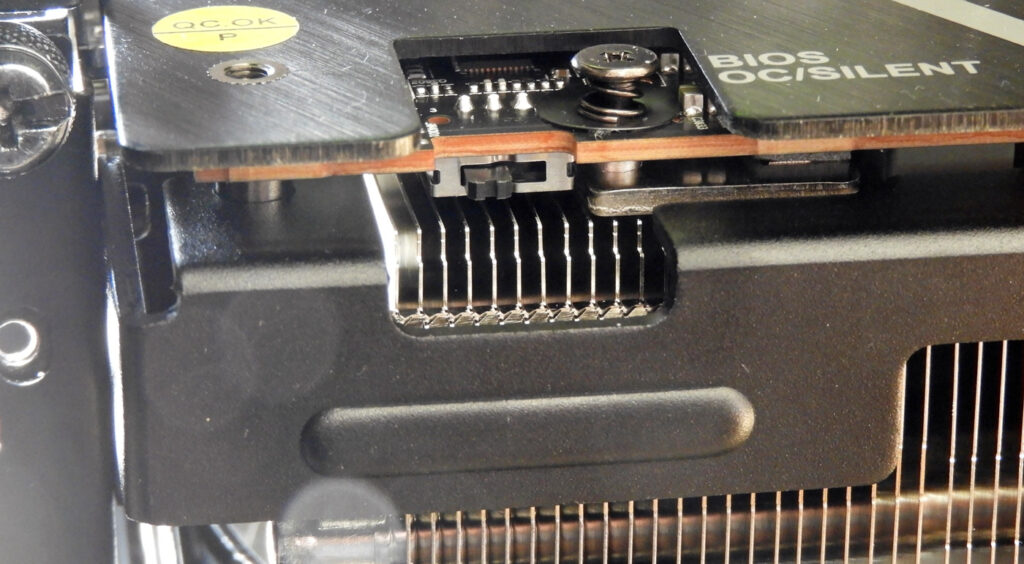
- The Hellhound has two modes, OC and silent, with a BIOS switch on the side of the card. Even in OC mode, it is considerably quieter than the reference board, and the silent mode is indeed very quiet.
- The 14-layer Tg PCB board has 12+3+2+2+1 Phase voltage regulator module (VRM) design. Hellhounds are overspec’d in order to deliver the best stability and overclocking headroom. By having high-quality VRMs, it will run cooler and last longer, claims the company.
- DrMOS and high-polymer capacitors are used for additional stability and reliability.
- The cooler features three nine-blade ball bearing fans with eight heat pipes (8X6Φ) across a high-density heat sink with a copper base. The PCB is shorter than the cooler.
- It uses mute fan technology, and the fans stop under 60 ˚C.
- The Hellhound RX 7900 XTX includes card stands for supporting it so as to not put extra strain on the PCIe slot.
- The RX 7900 XTX is AMD’s brand-new RDNA 3-based flagship AIB. The Hellhound represents one of the best choices for a mildly factory overclocked $999 AIB by virtue of its high-quality components and carefully selected GPUs, coupled with good support and great warranty service.
All Pmark and benchmark data were obtained using the PowerColor RX 7900 XTX unless otherwise noted.
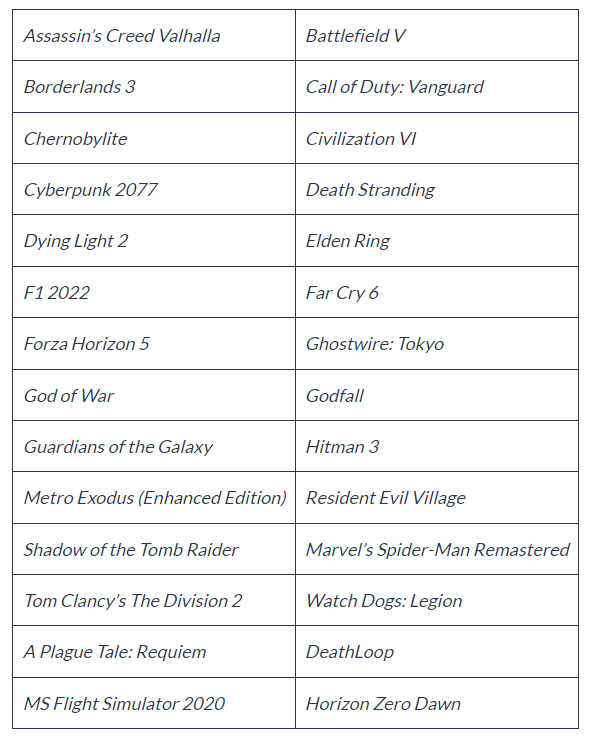
We tested our boards in over 40 games in three APIs (Vulcan, DX12, and DX11), in both 4K resolution and 1440p at the highest setting allowed in each game and with ray-tracing enabled. We also tested using the 3DMark Fire Strike and Time Spy benchmarks. Today, we are focusing on the performance jump between the RX 7900 XTX and the RX 6900 XT without FidelityFX enabled.
We benchmarked using Intel’s Core i9-13900KF CPU, and 32GB of T-Force Delta RGB DDR5 6400MHz CL40 2× 16GB memory on an Asus Prime Z790-A WIFI motherboard with fast SSD storage. All games and benchmarks are patched to their latest versions, and we use recent drivers.
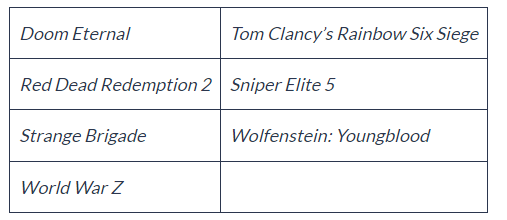
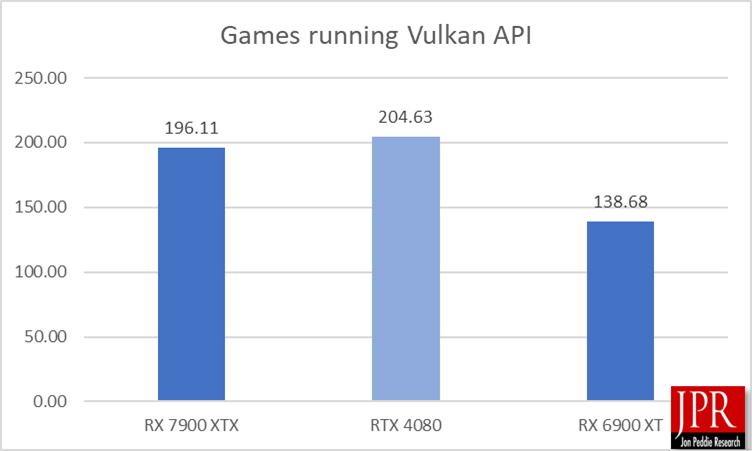
The RX 7900 XTX outperformed the RX 6900 XT by 40% running in our Vulkan test suite, while remaining competitive with the RTX 4080 and staying with 4%; these numbers remained remarkably consistent throughout the suite of tests.
The following table consists of the games used in our DirectX 12 suite.

The performance numbers remained consistent, with the RX 7900 XTX seeing a 43% gain over the RX 6900 XT, while staying within 4% of the RTX 4080.
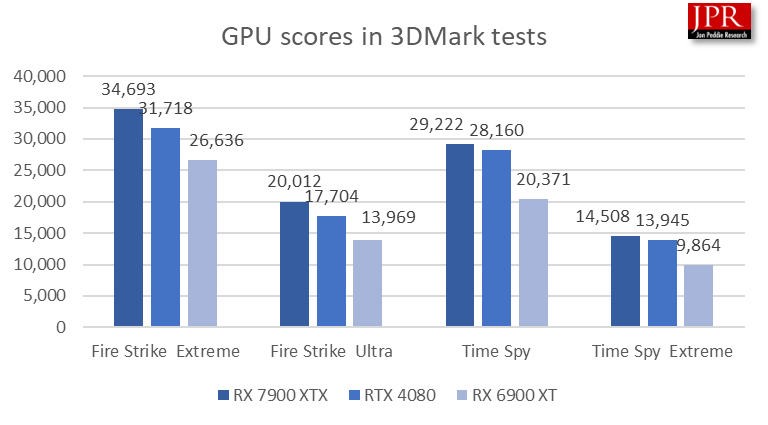
The RX 7900 XTX performed well in 3DMark, outscoring the RX 6900 XT by an average of 40% and even besting the RTX 4080 in the four tests.
The raw average FPS and synthetic scores are represented in the following table. In addition to the game scores, JPR includes its own Pmark computation, which factors in the power and MSRP of the add-in boards.
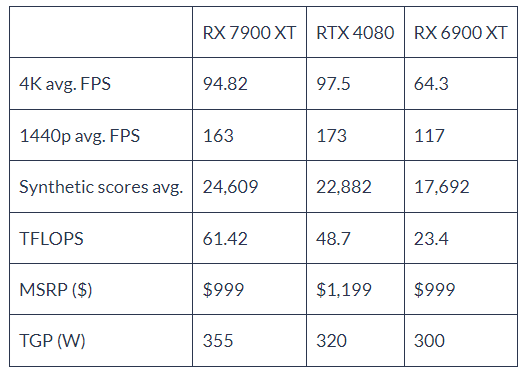
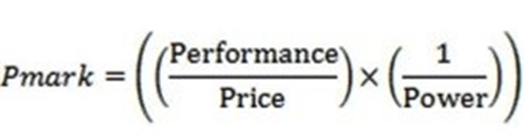
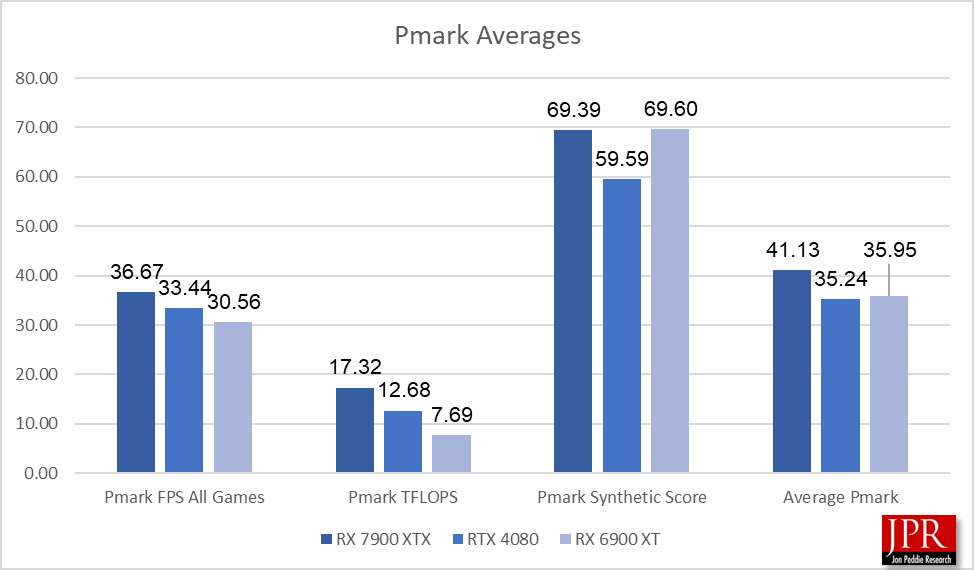
The Pmark scores for the RX 7900 XTX and RTX 4080 are remarkably close, with the RX 7900 XTX showing only a 9% difference in frames per second (FPS) Pmark advantage in all games. The RTX 4080 enjoys a 4% performance gain over the RT 7900 XTX as well as a power/watt advantage, but the $200 price increase over the RX 7900 XTX allows the RDNA 3.0 AIB to take the Pmark crown.
Where the RX 7900 XTX falls short of the RTX 4080 is in the field of ray tracing. In games where enabling high-end ray tracing is an option, such as Cyberpunk 2077, the RTX 4080 outperforms the RX 7900 XT by 40%, and in Chernobylite, with the Ultra RT option enabled, the AMD AIB is again outclassed by a 40% margin.
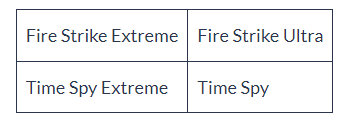
In addition to enabling ray tracing in games, we ran four synthetic ray-tracing benchmarks listed in the following table.
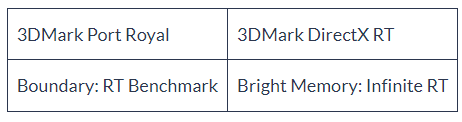
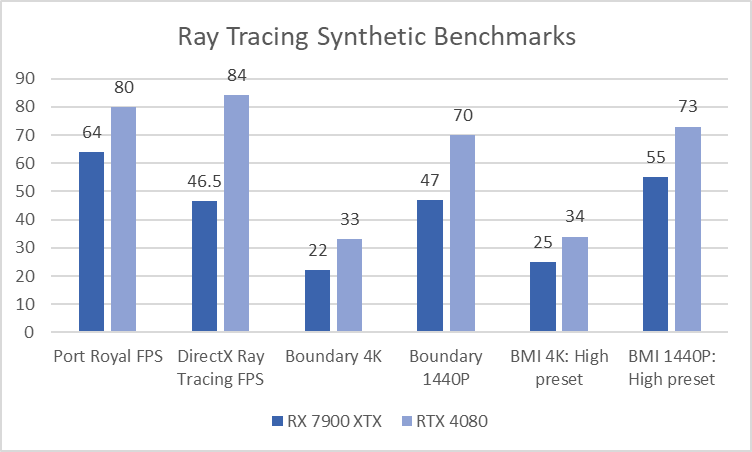
The RTX 4080 outclassed the RX 7900 XT by an average of 45% in these tests. How important hard-core ray tracing is to the consumer is a personal preference. The vast majority of games are still not utilizing ray tracing to a large extent.
What do we think?
We have been waiting for a high-end AMD add-in board for two years. We expected a large performance bump from the RDNA 3.0, and we got it. With zero increase in price and an 18% increase in power, we are seeing a monstrous 40-45% increase in performance.
For an add-in board that is 11% less expensive than its nearest competitor, we are only seeing a 4% loss in performance overall.
This is a great debut for the RDNA 3.0 family, and we are looking forward to the rest of the series.