 The Ada Lovelace GPU die. (Source: Nvidia)
The RTX 4090 is the most anticipated launch of a GPU since 2020, when AMD introduced RDNA 2.0, or 2018, when Nvidia launched the Turing family with a focus on its ray-tracing capabilities. The release of the 40 series is more compelling because it is built on the new Ada Lovelace architecture using TSMC’s 4nm N4 technology, along with all the new features that come with the new architecture.
The RTX 4000 series promises to offer a substantial upgrade in raw performance despite being constructed on a smaller die. The Ada Lovelace architecture at the heart of each GeForce RTX 40 series AIB is a massive generational leap in transistors as well as power efficiency and capabilities. The 4000 series is built on a custom TSMC N4 process with up to 76 billion transistors (compared to the last generation’s 28 billion). The company claims Ada is the world’s most advanced GPU architecture ever created.
Streaming multiprocessors (SMs) provide the primary performance for games. Having doubled peak FP32 throughput in the last-generation GPU, Nvidia has more than doubled peak throughput with Ada. The new GPU, says the company, can obtain up to 83 TFLOPS on the GeForce RTX 4090. That’s compared to the 40 Shader-TFLOPS of their fastest previous-generation GPU.
The RTX 40 series GPUs feature a range of new technological innovations, including:
- Streaming multiprocessors with up to 83 TFLOPS of shader power—2× over the previous generation.
- Third-generation RT cores with up to 191 effective ray-tracing TFLOPS—2.8× over the previous generation.
- Fourth-generation tensor cores with up to 1.32 tensor PFLOPS—5× over the previous generation using FP8 acceleration.
- Shader Execution Reordering (SER) improves execution efficiency by rescheduling shading workloads on the fly to utilize the GPU’s resources better. As significant innovation as out-of-order execution was for CPUs, SER improves ray-tracing performance up to 3× and in-game frame rates by up to 25%.
- Ada Optical Flow Accelerator with 2× faster performance allows DLSS 3 to predict movement in a scene, enabling the neural network to boost frame rates while maintaining image quality.
- Architectural improvements coupled with custom TSMC N4 process technology result in as much as a 2× leap in power efficiency.
- Dual Nvidia Encoders (NVENC) cut export times by up to half and feature AV1 support. NVENC AV1 encode is being adopted by OBS, Blackmagic Design, DaVinci Resolve, Discord, and others.
DLSS 3.0 is a main focus of Nvidia’s new features for the RTX 400 series. When DLSS 2.0 was introduced, Nvidia claimed that DLSS 2.0 and its super-resolution technology in CPU-limited games could increase frame rates in some games by up to 200%. The company claims that DLSS 3.0 can boost them by up to 400%. We will look at DLSS 3.0 performance in a future review. Today, we are focused on the raw upgrade in performance from the RTX 3090 to the RTX 4090, as well as performance per watt.
The AD102 specs are impressive compared to the GPU of the previous generation, yet the die is smaller.
| RTX 4090 | RTX 3090 | Difference | |
| Architecture | Ada Lovelace | Ampere | |
| GPU | AD102 | GA102 | |
| Process node | 4 nm TSMC | 8 nm Samsung | 0% |
| Transistors (b) | 76 | 28.3 | 269% |
| Die size mm² | 608 | 628 | 0.96% |
| Cuda cores | 16384 | 10496 | 156% |
| RT cores | 128 | 82 | 156% |
| Tensor cores | 512 | 328 | 156% |
| Base clock (MHz) | 2235 | 1395 | 160% |
| Boost clock (MHz) | 2520 | 1695 | 149% |
| Memory speed (Gbps) | 21 | 19.5 | 108% |
| Bandwidth (Gbps) | 1008 | 936 | 108% |
| TDP (Watts) | 450 | 350 | 129% |
| MSRP (at launch) | $1599 | $1499 | 6.6% |
| Comparison of Ada Lovelace to last-gen Ampere GPU | |||
The RTX 4090 Founders Edition add-in board is every bit as large as the EVGA FTW3 3090 Ti Ultra that we tested back in April. The AIB is 12 inches in length and 5.5 inches in width, and takes up three slots and weighs in over 6 pounds. The AD100 GPU on the RTX 4090 has more of everything; using a 4 nm process, the die size is 4% smaller, while the power consumption is 129% greater—more watts per square millimeter. That means the cooling requirements are much higher, which will add bulk to this impressive add-in board.
 The RTX 4090 Founder’s Edition at home in its natural environment
We tested the Ada Lovelace-based RTX 4090 with the Turing RTX 3090, and the Navi 21-based AMD RX 6900 XT.
| RTX 4090 | RTX 3090 | RX 6900 XT | |
| Architecture | Ada Lovelace | Ampere | RDNA 2.0 |
| GPU | AD 102 | GA 102 | Navi 21 |
| Process node | 4 nm TSMC | 8 nm Samsung | 7 nm TSMS |
| Transistors (b) | 76 | 28.3 | 26.8 |
| Die size (mm²) | 608 | 628 | 520 |
| Cores | 16384 | 10496 | 5120 |
| RT Cores | 128 | 82 | 80 |
| Tensor cores | 512 | 328 | |
| Base clock (MHz) | 2235 | 1395 | 1825 |
| Boost clock (MHz) | 2520 | 1695 | 2250 |
| Memory speed (Gbps) | 21 | 19.5 | 16 |
| Bandwidth GB/s | 1018 | 936 | 512 |
| Memory type | GDDR6X | GDDR6 | GDDR6 |
| Memory clock (MHz) | 1325 | 1219 | 2000 |
| TDP (W) | 450 | 350 | 450 |
| MSRP$ (at launch) | 1599 | 1499 | 999 |
| Driver | GeForce press driver | GeForce press driver | 22.10.1 |
We tested our boards in over 40 games in three APIs (Vulcan, DX 12, and DX 11), in both 4K resolution and 1440p at the highest setting allowed in each game with ray tracing enabled. We also tested using the 3DMark Fire Strike and Time Spy. Today, we are focusing on the performance jump between the RTX 4090 and RTX 3090 without DLSS 3.0. We will be reviewing DLSS 3.0 in a future story.
| Intel Core i9-12900KF | ASUS ROG Maximus Z690 Apex LGA1700 motherboard |
| T-Force Delta RGB PC5-51200 6400MHz DDR5 CL40 2x16GB kit | Gigabyte RX 6900 XT GAMING OC, GV-R69XTGAMING OC-16GD 16GB |
| 2 x T-Force Cardea Ceramic C440; 2TB PCIe Gen 4×4 NVMe SSD | T-Force M200 4TB USB 3.2 Gen2x2 Type-C Portable SSD |
| Super Flower LedEx, 1200 W Platinum 80+ power supply | BenQ EW3270U 32-inch 4K HDR 60 Hz FreeSync monitor |
| LG C1 48-inch 4K OLED HDR 120 Hz display | |
| Hardware test bed | |
The following table shows the games we used to test with the Vulkan API.
| DOOM Eternal | Ghost Recon Breakpoint |
| Red Dead Redemption 2 | Sniper Elite 5 |
| Strange Brigade | Wolfenstein Youngblood |
| World War Z | |
| Vulkan test suite | |
 Average framerates in 4K with Vulkan API
 Percent change for the RTX 4090 over the RTX 3090 and RX 6900 XT
The RTX 4090 has 71% better performance in games running Vulkan in 4K resolution and 56% better performance in 1440p. Nvidia emphasized that the RTX 4090 should be tested in 4K (or 8K) with ray tracing at max settings; we performed those tests but also added the 1440p to show more mainstream gamers the performance advantage of the new GPU.
The following table consists of the games used in our DirectX 12 suite.
| Assassin’s Creed Valhalla | Battlefield V |
| Borderlands 3 | Call of Duty: Vanguard |
| Chernobylite | Civilization VI |
| Cyberpunk 2077 | Death Stranding |
| Dying Light 2 | Elden Ring |
| F1 2022 | Far Cry 6 |
| Forza Horizon 5 | Ghostwire: Tokyo |
| God of War | Godfall |
| Guardians of the Galaxy | Hitman 3 |
| Metro Exodus (Enhanced Edition) | Resident Evil Village |
| Shadow of Tomb Raider | Spiderman: Remastered |
| Tom Clancy’s The Division 2 | Watch Dogs: Legion |
| DirectX 12 test suite | |
 Average framerates in 4K with DX12 API
 Percent change for the RTX 4090 over the RTX 3090 and RX 6900 XT
The RTX 4090 shows a 78% performance gain over the RTX 3090 in games running with DX12 in 4K and a 57% gain in 1440p; again, these tests are conducted with top-end presets with ray tracing enabled.
The following table consists of the games used in our DirectX 11 suite.
| Crysis Remastered | Days Gone |
| Destiny 2 | Grand Theft Auto V |
| Overwatch 2 | Total War: Kingdoms |
| Total War: Warhammer III | |
| DirectX 11 test suite | |
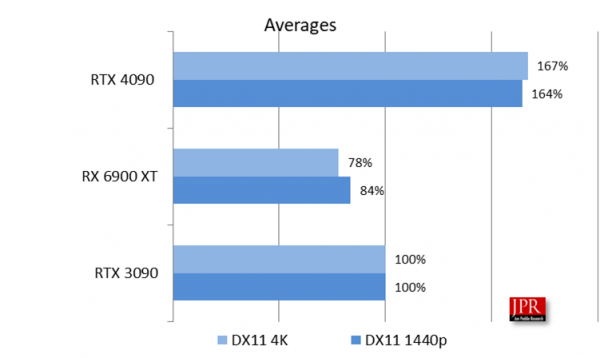
Percent change for the RTX 4090 over the RTX 3090 and RX 6900 XT
The RTX 4090 showed a 67% performance increase in 4K running DX11 and 64% while testing in 1440p.
As the chart above indicates the RTX 4090 outclasses the RTX 3090 and RX 6900 XT when it comes to pure frame rate, producing a 70% advantage over its predecessor, the RTX 3090.
Along with a suite of games, we also tested the RTX 4090 with UL benchmarks.
| Fire Strike: Extreme | Fire Strike: Ultra |
| Time Spy | Time Spy: Extreme |
| Synthetic benchmark test suite | |
 Scores for the RTX 4090, RTX 3090, and RX 6900 XT in 3D Mark

Percent change for the RTX 4090 over the RTX 3090 and RX 6900 XT in 3D Mark
The RTX 4090 outperforms the RTX 3090 by an average of 70% in 3DMark benchmarks.
The raw average FPS and synthetic scores are represented in the following table. In addition to the game scores, JPR includes its Pmark computation, which factors in the power and MSRP of the add-in boards.
| RTX 4090 | RTX 3090 | Rx 6900 XT | |
| 4K Avg. FPS | 135.5 | 79.5 | 66.7 |
| 1440p Avg. FPS | 205 | 131 | 117 |
| Synthetic scores | 24164 | 14593 | 14353 |
| TFLOPS | 82.58 | 35.58 | 23.04 |
| $ MSRP | 1599 | 1499 | 999 |
| TDP (W) | 450 | 350 | 300 |
| Pmark comparison variables | |||
 |
|
| Pmark equation |
 Pmark comparison
Not surprisingly, the RX 6900 XT performed very well in the Pmark scoring. The RX 6900 XT produced solid frame rates in both 4K and 1440p gaming. The high MSRP and 450 W power usage of the RTX 4090 held it back in this comparison.
Where the RTX 4090 shines is in high-end gaming raw performance with ray tracing and all the bells and whistles enabled.
In 4K gaming with ray tracing enabled, the RTX 4090’s average frame rates enjoy a 104% difference over the RX 6900 XT and 70% better than the RTX 3090. It boasts close to twice the performance at the same power as Ampere and excellent scalability and overclocking ability as power consumption increases.
 Nvidia’s Ada Lovelace power-performance efficiency compared to previous generations. (Source: Nvidia)
SMs provide the primary performance for games. Having doubled peak FP32 throughput in the last-generation GPU, Nvidia has more than doubled peak throughput with the Ada. The new GPU, says the company, can obtain up to 83 TFLOPs on the GeForce RTX 4090. That’s compared to the 40 Shader-TFLOPS of their fastest previous-generation GPU.
The RTX 4090 is a massive add-in board, and starting at $1,599, it is very expensive. However, the add-in board is only 6% more expensive than the RTX 3090 yet provides a 70% performance spike. The performance jump of the RTX 2080 from the GTX 1080 was 49% on average. This massive 70% performance jump in FPS does not include the new features that are included with the new Ada Lovelace series, such as DLSS 3, which we will be taking a closer look at in our next round of testing.
We will also be testing with Frameview and measuring image quality and latency, along with frame rates, in upcoming reviews.
What do we think?
The industry has been eagerly anticipating this release of the next generation of GPUs along with the features that the 4000 series will bring to consumers. The successful debut of the AD102 flagship GPU bodes well for the series as a whole.
A 70% performance jump from generation to generation is outstanding, and DLSS 3 with frame generation tech, super resolution, and Reflex promises another 2×–4× performance spike.
The GeForce RTX 4090 is primarily designed for the most ambitious users—some folks want to game at the highest resolution with everything enabled. They crave the most immersive experience, no matter the price, and are the early adopters of next-generation 8K displays.
The RTX 4090 proves frame rates well over 100 FPS with the most stressful settings for a GPU, and this add-in board and series, along with DLSS, will make gaming in 8K a reality—and not just for the very top end.
Editor’s note: Many thanks to a friend of Jon Peddie Research, Mark Poppin of BabelTech Reviews. We encountered a technical issue with our test bed early in our testing, and he was generous enough to step in and provide us with much of the data used in this review. Please visit BabelTech and view Mark’s take on the release of the RTX 4090.